
- Home >
- Stock Videos >
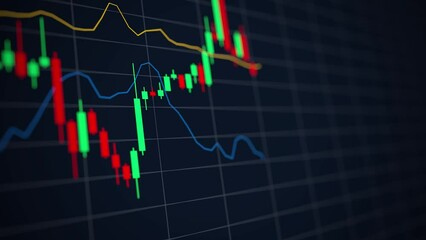
- Dynamic Financial Graphs in Digital Stock Market Animation
Dynamic Financial Graphs in Digital Stock Market Animation Video

Vibrant animation depicting fluctuating stock market graphs and numerical data overlaid on a dynamic trading board. Suitable for use in business presentations, educational content about financial markets, and digital marketing materials related to stock trading or economic analysis. Offers a futuristic and tech-savvy visual appeal for illustrating financial trends and data analytics.
Powered by 


18
downloads
downloads
Tags:
More
Credit Photo
If you would like to credit the Photo, here are some ways you can do so
Text Link
video Link
<span class="text-link">
<span>
<a target="_blank" href=https://pikwizard.com/video/dynamic-financial-graphs-in-digital-stock-market-animation/5d6af6155a95168bbcd1857b21c8f607/>PikWizard</a>
</span>
</span>
<span class="image-link">
<span
style="margin: 0 0 20px 0; display: inline-block; vertical-align: middle; width: 100%;"
>
<a
target="_blank"
href="https://pikwizard.com/video/dynamic-financial-graphs-in-digital-stock-market-animation/5d6af6155a95168bbcd1857b21c8f607/"
style="text-decoration: none; font-size: 10px; margin: 0;"
>
<video controls style="width: 100%; margin: 0;">
<source src="https://player.vimeo.com/progressive_redirect/playback/849848903/rendition/240p/file.mp4?loc=external&oauth2_token_id=1223210874&signature=63e818b42a1943023e7ef8dae85dbad2b2b7db075572e8945c0cdf395b193e34" type="video/mp4"
poster="https://pikwizard.com/pw/medium/5d6af6155a95168bbcd1857b21c8f607.jpg"/>
Your browser does not support the video tag.
</video>
<p style="font-size: 12px; margin: 0;">PikWizard</p>
</a>
</span>
</span>
Free (free of charge)
Free for personal and commercial use.
Author: Awesome Content