
- Home >
- Stock Videos >
- Dynamic Financial Graphs Over Wind Turbine Illustrating Global Economy
Dynamic Financial Graphs Over Wind Turbine Illustrating Global Economy Video
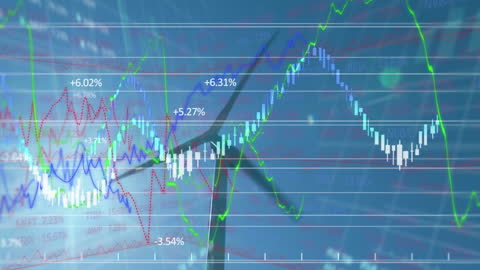
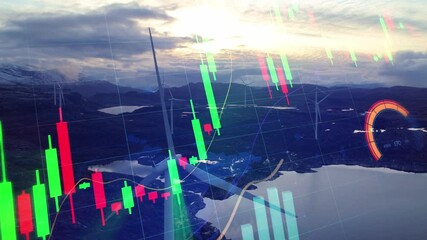
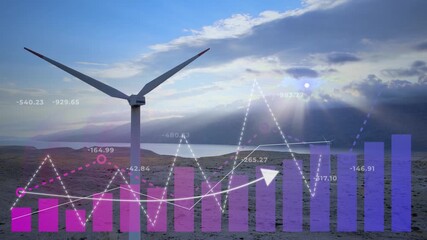
A representation of renewable energy and key economic metrics with dynamic financial graphs superimposed over a wind turbine. Seamlessly integrating finance and sustainable energy concepts, this visual aids presentations in economic reports, renewable energy sector overviews, or discussion on global market trends.
Powered by 


1
downloads
downloads
Tags:
More
Credit Photo
If you would like to credit the Photo, here are some ways you can do so
Text Link
video Link
<span class="text-link">
<span>
<a target="_blank" href=https://pikwizard.com/video/dynamic-financial-graphs-over-wind-turbine-illustrating-global-economy/cd3fd074a646231cc0d46a45313393da/>PikWizard</a>
</span>
</span>
<span class="image-link">
<span
style="margin: 0 0 20px 0; display: inline-block; vertical-align: middle; width: 100%;"
>
<a
target="_blank"
href="https://pikwizard.com/video/dynamic-financial-graphs-over-wind-turbine-illustrating-global-economy/cd3fd074a646231cc0d46a45313393da/"
style="text-decoration: none; font-size: 10px; margin: 0;"
>
<video controls style="width: 100%; margin: 0;">
<source src="https://player.vimeo.com/progressive_redirect/playback/718440571/rendition/240p/file.mp4?loc=external&oauth2_token_id=1223210874&signature=8e117827ff8efcc788d3d1f15e116d472f358e5b5760ead08ea6ad8ea77af660" type="video/mp4"
poster="https://pikwizard.com/pw/medium/cd3fd074a646231cc0d46a45313393da.jpg"/>
Your browser does not support the video tag.
</video>
<p style="font-size: 12px; margin: 0;">PikWizard</p>
</a>
</span>
</span>
Free (free of charge)
Free for personal and commercial use.
Author: Awesome Content