
- Home >
- Stock Videos >
- Dynamic Financial Growth Analysis with Data Visualization
Dynamic Financial Growth Analysis with Data Visualization Video
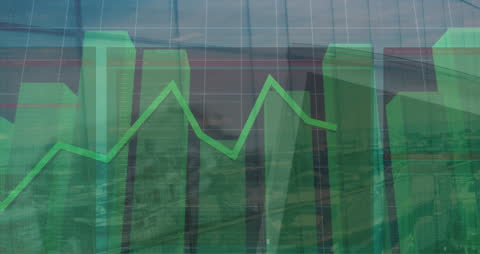
Abstract representation of financial data analysis with a green graph and arrows depicting growth and trends. The backdrop suggests technological data processing, resonating with global connections in shipping and economic activity. Ideal for uses in financial presentations, economic progress reports, business graphs, and investment strategy materials.

downloads
Tags:
More
Credit Photo
If you would like to credit the Photo, here are some ways you can do so
Text Link
video Link
<span class="text-link">
<span>
<a target="_blank" href=https://pikwizard.com/video/dynamic-financial-growth-analysis-with-data-visualization/9e3c96d4437812dcc006c5845db0cf1c/>PikWizard</a>
</span>
</span>
<span class="image-link">
<span
style="margin: 0 0 20px 0; display: inline-block; vertical-align: middle; width: 100%;"
>
<a
target="_blank"
href="https://pikwizard.com/video/dynamic-financial-growth-analysis-with-data-visualization/9e3c96d4437812dcc006c5845db0cf1c/"
style="text-decoration: none; font-size: 10px; margin: 0;"
>
<video controls style="width: 100%; margin: 0;">
<source src="https://player.vimeo.com/progressive_redirect/playback/759627838/rendition/240p/file.mp4?loc=external&oauth2_token_id=1223210874&signature=a1541a7e784acad5f9b3f9baa4f9697d7e46bb35c960afb3cea8314da27e55de" type="video/mp4"
poster="https://pikwizard.com/pw/medium/9e3c96d4437812dcc006c5845db0cf1c.jpg"/>
Your browser does not support the video tag.
</video>
<p style="font-size: 12px; margin: 0;">PikWizard</p>
</a>
</span>
</span>
Free (free of charge)
Free for personal and commercial use.
Author: Awesome Content