
- Home >
- Stock Videos >
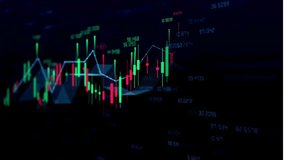
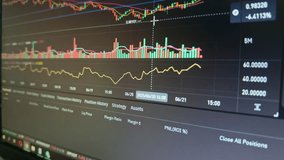
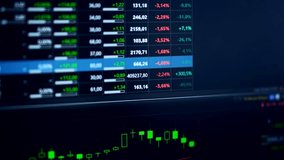
- Dynamic Financial Market Analysis Digitally Visualized with Real-time Data Graphs
Dynamic Financial Market Analysis Digitally Visualized with Real-time Data Graphs Video

AI
AI Generated Video. Video visualizes digital financial market analysis with dynamic charts and candlestick bar patterns, illustrating trend shifts in real-time. Ideal for businesses, educational content, or tech blogs probing into market analysis methods, data-driven decision making, futuristic technology in AI-driven analytics, or demonstrating economic trends visually.
Powered by  - Get 15% off with code: PIKWIZARD15


downloads
Tags:
More
Credit Photo
If you would like to credit the Photo, here are some ways you can do so
Text Link
video Link
<span class="text-link">
<span>
<a target="_blank" href=https://pikwizard.com/video/dynamic-financial-market-analysis-digitally-visualized-with-real-time-data-graphs/99d072a5bd9bd02360fa00af4fc80f78/>PikWizard</a>
</span>
</span>
<span class="image-link">
<span
style="margin: 0 0 20px 0; display: inline-block; vertical-align: middle; width: 100%;"
>
<a
target="_blank"
href="https://pikwizard.com/video/dynamic-financial-market-analysis-digitally-visualized-with-real-time-data-graphs/99d072a5bd9bd02360fa00af4fc80f78/"
style="text-decoration: none; font-size: 10px; margin: 0;"
>
<video controls style="width: 100%; margin: 0;">
<source src="https://player.vimeo.com/progressive_redirect/playback/1132874885/rendition/240p/file.mp4?loc=external&oauth2_token_id=1223210874&signature=a628a60653b1b1059a6460ba9a8d50afbdd44ba6748cac39ea666ff182236d5a" type="video/mp4"
poster="https://pikwizard.com/pw/medium/99d072a5bd9bd02360fa00af4fc80f78.jpg"/>
Your browser does not support the video tag.
</video>
<p style="font-size: 12px; margin: 0;">PikWizard</p>
</a>
</span>
</span>
Free (free of charge)
Free for personal and commercial use.
Author: AI Creator