
- Home >
- Stock Videos >
- Dynamic Financial Market Analysis with Vibrant Bar Graphs
Dynamic Financial Market Analysis with Vibrant Bar Graphs Video
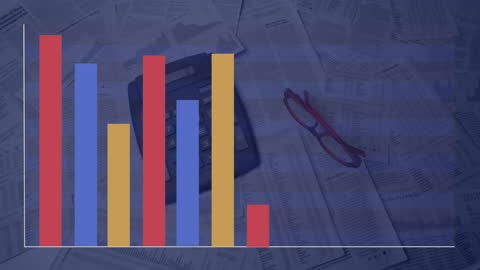
Overlay of colorful bar graphs demonstrates engaging financial analysis and market trends comprehension on top of documents and calculator. Suitable for financial analytics presentations, business strategy meetings, and economic forecasts. Useful for expressing data-driven decisions with an international focus in financial themes.
Powered by 


0
downloads
downloads
Tags:
More
Credit Photo
If you would like to credit the Photo, here are some ways you can do so
Text Link
video Link
<span class="text-link">
<span>
<a target="_blank" href=https://pikwizard.com/video/dynamic-financial-market-analysis-with-vibrant-bar-graphs/a7242aa6110e1a08ff6e87c382712c00/>PikWizard</a>
</span>
</span>
<span class="image-link">
<span
style="margin: 0 0 20px 0; display: inline-block; vertical-align: middle; width: 100%;"
>
<a
target="_blank"
href="https://pikwizard.com/video/dynamic-financial-market-analysis-with-vibrant-bar-graphs/a7242aa6110e1a08ff6e87c382712c00/"
style="text-decoration: none; font-size: 10px; margin: 0;"
>
<video controls style="width: 100%; margin: 0;">
<source src="https://player.vimeo.com/progressive_redirect/playback/765153166/rendition/240p/file.mp4?loc=external&oauth2_token_id=1223210874&signature=06b90d5fae45c106b0d4e4ad3cbc5f3152dbd7dec84273dbdccbe88990815560" type="video/mp4"
poster="https://pikwizard.com/pw/medium/a7242aa6110e1a08ff6e87c382712c00.jpg"/>
Your browser does not support the video tag.
</video>
<p style="font-size: 12px; margin: 0;">PikWizard</p>
</a>
</span>
</span>
Free (free of charge)
Free for personal and commercial use.
Author: Awesome Content