
- Home >
- Stock Videos >
- Dynamic Financial Market Display with Graphs
Dynamic Financial Market Display with Graphs Video
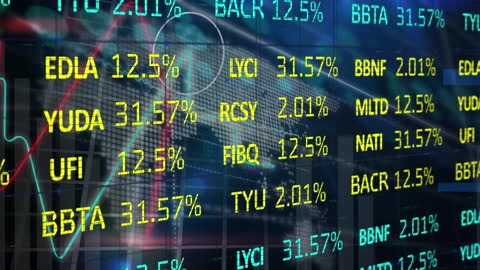
Animated display highlighting financial and stock market data with various economic graphs and percentages on blue background. Useful for financial news presentations, stock analysis videos, trading advertisements, or business finance tutorials.
Powered by 


Credit Photo
If you would like to credit the Photo, here are some ways you can do so
Text Link
video Link
<span class="text-link">
<span>
<a target="_blank" href=https://pikwizard.com/video/dynamic-financial-market-display-with-graphs/b0988861249d9764782c7cba1556f15f/>PikWizard</a>
</span>
</span>
<span class="image-link">
<span
style="margin: 0 0 20px 0; display: inline-block; vertical-align: middle; width: 100%;"
>
<a
target="_blank"
href="https://pikwizard.com/video/dynamic-financial-market-display-with-graphs/b0988861249d9764782c7cba1556f15f/"
style="text-decoration: none; font-size: 10px; margin: 0;"
>
<video controls style="width: 100%; margin: 0;">
<source src="https://player.vimeo.com/progressive_redirect/playback/765621059/rendition/240p/file.mp4?loc=external&oauth2_token_id=1223210874&signature=492ecc2bfe865dad2985a2cc50018a40dd91b4257c879e9c43b74f2f380df1d3" type="video/mp4"
poster="https://pikwizard.com/pw/medium/b0988861249d9764782c7cba1556f15f.jpg"/>
Your browser does not support the video tag.
</video>
<p style="font-size: 12px; margin: 0;">PikWizard</p>
</a>
</span>
</span>
Free (free of charge)
Free for personal and commercial use.
Author: Awesome Content