
- Home >
- Stock Videos >
- Dynamic Global Financial Data Analysis on Grid
Dynamic Global Financial Data Analysis on Grid Video
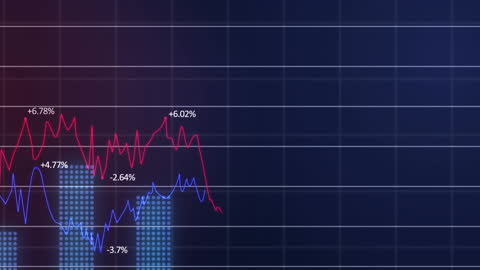
This powerful illustration features dynamic financial data depicted on a grid, highlighting global economic trends and stock market volatility. Red and blue lines represent fluctuating economic indicators, showcasing real-time stock trading insights. Ideal for use in presentations on global finance, economics, stock market analysis, or corporate business strategies.

downloads
Tags:
More
Credit Photo
If you would like to credit the Photo, here are some ways you can do so
Text Link
video Link
<span class="text-link">
<span>
<a target="_blank" href=https://pikwizard.com/video/dynamic-global-financial-data-analysis-on-grid/fdae2d646e2280febfb6b94ae7710741/>PikWizard</a>
</span>
</span>
<span class="image-link">
<span
style="margin: 0 0 20px 0; display: inline-block; vertical-align: middle; width: 100%;"
>
<a
target="_blank"
href="https://pikwizard.com/video/dynamic-global-financial-data-analysis-on-grid/fdae2d646e2280febfb6b94ae7710741/"
style="text-decoration: none; font-size: 10px; margin: 0;"
>
<video controls style="width: 100%; margin: 0;">
<source src="https://player.vimeo.com/progressive_redirect/playback/758898065/rendition/240p/file.mp4?loc=external&oauth2_token_id=1223210874&signature=93b7ebf0a6ef108aef8cee8c942bc788388f9a95ae3be1f8298c509e908e940f" type="video/mp4"
poster="https://pikwizard.com/pw/medium/fdae2d646e2280febfb6b94ae7710741.jpg"/>
Your browser does not support the video tag.
</video>
<p style="font-size: 12px; margin: 0;">PikWizard</p>
</a>
</span>
</span>
Free (free of charge)
Free for personal and commercial use.
Author: Awesome Content