
- Home >
- Stock Videos >
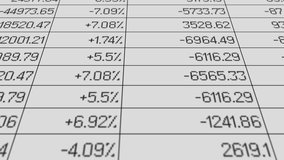
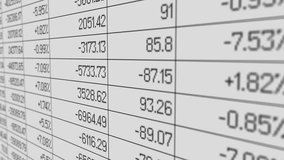
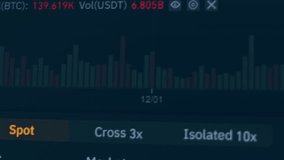
- Dynamic Global Stock Market Analytics and Data Visualization
Dynamic Global Stock Market Analytics and Data Visualization Video

Dynamic presentation capturing real-time stock market analysis overlaying a graphic of a globe, representing global financial movement and trends. Ideal for conceptual business presentations, fintech startups, finance-related digital platforms, and educational materials focused on investment strategies.
Powered by  - Get 15% off with code: PIKWIZARD15


downloads
Tags:
More
Credit Photo
If you would like to credit the Photo, here are some ways you can do so
Text Link
video Link
<span class="text-link">
<span>
<a target="_blank" href=https://pikwizard.com/video/dynamic-global-stock-market-analytics-and-data-visualization/5a3cc8dbe143e5745337ca98f5cdab91/>PikWizard</a>
</span>
</span>
<span class="image-link">
<span
style="margin: 0 0 20px 0; display: inline-block; vertical-align: middle; width: 100%;"
>
<a
target="_blank"
href="https://pikwizard.com/video/dynamic-global-stock-market-analytics-and-data-visualization/5a3cc8dbe143e5745337ca98f5cdab91/"
style="text-decoration: none; font-size: 10px; margin: 0;"
>
<video controls style="width: 100%; margin: 0;">
<source src="https://player.vimeo.com/progressive_redirect/playback/767142170/rendition/240p/file.mp4?loc=external&oauth2_token_id=1223210874&signature=c28c097db8699270a97993a9c5320c6440a54a13cd15cd6e67fa338253e97034" type="video/mp4"
poster="https://pikwizard.com/pw/medium/5a3cc8dbe143e5745337ca98f5cdab91.jpg"/>
Your browser does not support the video tag.
</video>
<p style="font-size: 12px; margin: 0;">PikWizard</p>
</a>
</span>
</span>
Free (free of charge)
Free for personal and commercial use.
Author: Awesome Content