
- Home >
- Stock Videos >
- Dynamic Graph Animation Representing Financial Data Trends
Dynamic Graph Animation Representing Financial Data Trends Video
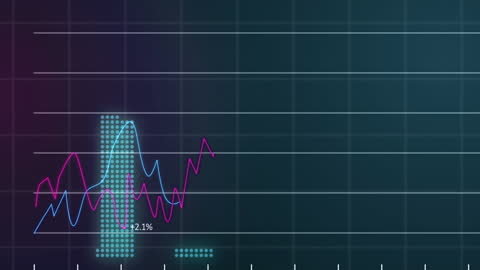
Vibrant animation illustrating shifting financial data on a digital grid suggests modern tools for economic analysis. Useful for presentations, financial reports, or educational content in business and finance courses, emphasizing the dynamic nature of markets.
Powered by 


downloads
Tags:
More
Credit Photo
If you would like to credit the Photo, here are some ways you can do so
Text Link
video Link
<span class="text-link">
<span>
<a target="_blank" href=https://pikwizard.com/video/dynamic-graph-animation-representing-financial-data-trends/8ed40c62372145cc4ecf1b4317fa6637/>PikWizard</a>
</span>
</span>
<span class="image-link">
<span
style="margin: 0 0 20px 0; display: inline-block; vertical-align: middle; width: 100%;"
>
<a
target="_blank"
href="https://pikwizard.com/video/dynamic-graph-animation-representing-financial-data-trends/8ed40c62372145cc4ecf1b4317fa6637/"
style="text-decoration: none; font-size: 10px; margin: 0;"
>
<video controls style="width: 100%; margin: 0;">
<source src="https://player.vimeo.com/progressive_redirect/playback/718177101/rendition/240p/file.mp4?loc=external&oauth2_token_id=1223210874&signature=ed6e2982539b68f1001a52a77007e6daf28b4750dbd40e33fb5acd9c3765b627" type="video/mp4"
poster="https://pikwizard.com/pw/medium/8ed40c62372145cc4ecf1b4317fa6637.jpg"/>
Your browser does not support the video tag.
</video>
<p style="font-size: 12px; margin: 0;">PikWizard</p>
</a>
</span>
</span>
Free (free of charge)
Free for personal and commercial use.
Author: Awesome Content