
- Home >
- Stock Videos >
- Dynamic Graph Animation with Numerical Data on Red Background
Dynamic Graph Animation with Numerical Data on Red Background Video
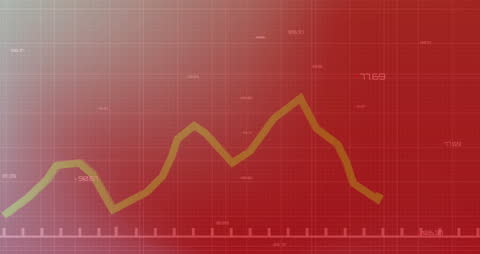
Graphic features a fluctuating line graph on a red gradient background with numerical data change in real-time across a grid pattern, creating a holographic effect. Useful for illustrating business reports, financial analysis, corporate presentations and marketing materials focused on market trends and economic data insights.

downloads
Tags:
More
Credit Photo
If you would like to credit the Photo, here are some ways you can do so
Text Link
video Link
<span class="text-link">
<span>
<a target="_blank" href=https://pikwizard.com/video/dynamic-graph-animation-with-numerical-data-on-red-background/3eaa76dcc1754d0c076de4efb618a455/>PikWizard</a>
</span>
</span>
<span class="image-link">
<span
style="margin: 0 0 20px 0; display: inline-block; vertical-align: middle; width: 100%;"
>
<a
target="_blank"
href="https://pikwizard.com/video/dynamic-graph-animation-with-numerical-data-on-red-background/3eaa76dcc1754d0c076de4efb618a455/"
style="text-decoration: none; font-size: 10px; margin: 0;"
>
<video controls style="width: 100%; margin: 0;">
<source src="https://player.vimeo.com/progressive_redirect/playback/831769849/rendition/240p/file.mp4?loc=external&oauth2_token_id=1223210874&signature=49aec0a993e776001e6b67d80ef591b7772c11316ef737d500153e28fdfacc62" type="video/mp4"
poster="https://pikwizard.com/pw/medium/3eaa76dcc1754d0c076de4efb618a455.jpg"/>
Your browser does not support the video tag.
</video>
<p style="font-size: 12px; margin: 0;">PikWizard</p>
</a>
</span>
</span>
Free (free of charge)
Free for personal and commercial use.
Author: Awesome Content