
- Home >
- Stock Videos >
- Dynamic Graph Displaying Global Digital Connectivity
Dynamic Graph Displaying Global Digital Connectivity Video
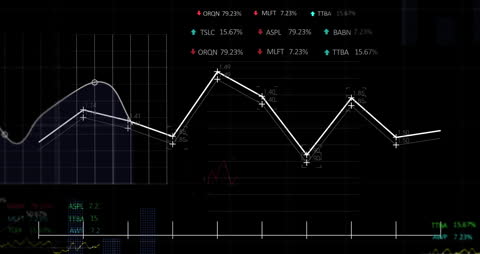
Graph visualization showcases fluctuating data points connecting in a digital interface, representing global connectivity and technological advancements. Ideal for illustrating concepts in digital landscapes, statistics education, data processing technologies, and analytical tools. Useful for presentations, tech seminars, or educational content on data management and global networks.
Powered by 


downloads
Tags:
More
Credit Photo
If you would like to credit the Photo, here are some ways you can do so
Text Link
video Link
<span class="text-link">
<span>
<a target="_blank" href=https://pikwizard.com/video/dynamic-graph-displaying-global-digital-connectivity/a38998352c4921999c14b9753b1265b9/>PikWizard</a>
</span>
</span>
<span class="image-link">
<span
style="margin: 0 0 20px 0; display: inline-block; vertical-align: middle; width: 100%;"
>
<a
target="_blank"
href="https://pikwizard.com/video/dynamic-graph-displaying-global-digital-connectivity/a38998352c4921999c14b9753b1265b9/"
style="text-decoration: none; font-size: 10px; margin: 0;"
>
<video controls style="width: 100%; margin: 0;">
<source src="https://player.vimeo.com/progressive_redirect/playback/759216151/rendition/240p/file.mp4?loc=external&oauth2_token_id=1223210874&signature=8fe4da3ad19b3990a37c677970b5102931425d3ab4d6748e904c906ecc429aab" type="video/mp4"
poster="https://pikwizard.com/pw/medium/a38998352c4921999c14b9753b1265b9.jpg"/>
Your browser does not support the video tag.
</video>
<p style="font-size: 12px; margin: 0;">PikWizard</p>
</a>
</span>
</span>
Free (free of charge)
Free for personal and commercial use.
Author: Awesome Content