
- Home >
- Stock Videos >
- Dynamic Graphs on Grid Network with Data Percentages
Dynamic Graphs on Grid Network with Data Percentages Video
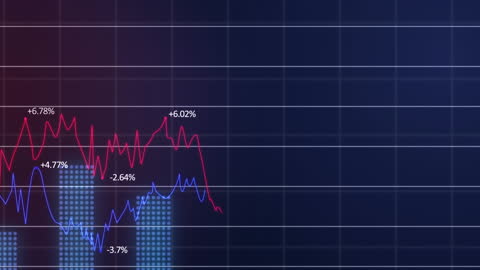
Illustrates dynamic data processing with red and blue trend lines and percentage indicators on a technological grid background. Useful for financial analyses, technology presentations, stock market reports, or business-related digital content.
Powered by 


downloads
Tags:
More
Credit Photo
If you would like to credit the Photo, here are some ways you can do so
Text Link
video Link
<span class="text-link">
<span>
<a target="_blank" href=https://pikwizard.com/video/dynamic-graphs-on-grid-network-with-data-percentages/b163a9653698d7502d530aa2978be2ee/>PikWizard</a>
</span>
</span>
<span class="image-link">
<span
style="margin: 0 0 20px 0; display: inline-block; vertical-align: middle; width: 100%;"
>
<a
target="_blank"
href="https://pikwizard.com/video/dynamic-graphs-on-grid-network-with-data-percentages/b163a9653698d7502d530aa2978be2ee/"
style="text-decoration: none; font-size: 10px; margin: 0;"
>
<video controls style="width: 100%; margin: 0;">
<source src="https://player.vimeo.com/progressive_redirect/playback/905672158/rendition/240p/file.mp4?loc=external&oauth2_token_id=1223210874&signature=291e5288e479170ad79325d1faaacbcedc7a9596af45572045dda68c6fdf1d4b" type="video/mp4"
poster="https://pikwizard.com/pw/medium/b163a9653698d7502d530aa2978be2ee.jpg"/>
Your browser does not support the video tag.
</video>
<p style="font-size: 12px; margin: 0;">PikWizard</p>
</a>
</span>
</span>
Free (free of charge)
Free for personal and commercial use.
Author: Awesome Content