
- Home >
- Stock Videos >
- Dynamic Graphs Overlaying Urban Skyline
Dynamic Graphs Overlaying Urban Skyline Video
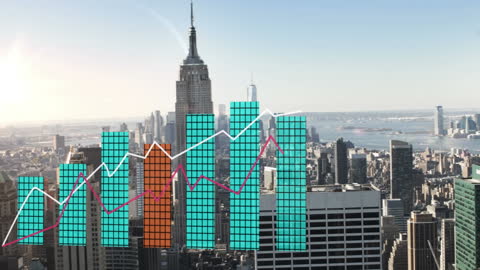
Several graphs and charts overlaid on an urban skyline depict dynamic growth or fluctuations, symbolizing the ever-changing economic landscape. Useful for finance or business-related presentations, articles focusing on urban development, or marketing materials highlighting economic trends in city settings.
Powered by 


downloads
Tags:
More
Credit Photo
If you would like to credit the Photo, here are some ways you can do so
Text Link
video Link
<span class="text-link">
<span>
<a target="_blank" href=https://pikwizard.com/video/dynamic-graphs-overlaying-urban-skyline/cb09bfde5effdad456bb21f84de4c983/>PikWizard</a>
</span>
</span>
<span class="image-link">
<span
style="margin: 0 0 20px 0; display: inline-block; vertical-align: middle; width: 100%;"
>
<a
target="_blank"
href="https://pikwizard.com/video/dynamic-graphs-overlaying-urban-skyline/cb09bfde5effdad456bb21f84de4c983/"
style="text-decoration: none; font-size: 10px; margin: 0;"
>
<video controls style="width: 100%; margin: 0;">
<source src="https://player.vimeo.com/progressive_redirect/playback/863868253/rendition/240p/file.mp4?loc=external&oauth2_token_id=1223210874&signature=90776bad36c64636dfb1b0e33d17b0e59d9f768018b1a5ea70eea958cb2066b2" type="video/mp4"
poster="https://pikwizard.com/pw/medium/cb09bfde5effdad456bb21f84de4c983.jpg"/>
Your browser does not support the video tag.
</video>
<p style="font-size: 12px; margin: 0;">PikWizard</p>
</a>
</span>
</span>
Free (free of charge)
Free for personal and commercial use.
Author: Awesome Content