
- Home >
- Stock Videos >
- Dynamic Green Bar Graph with Statistical Trends
Dynamic Green Bar Graph with Statistical Trends Video
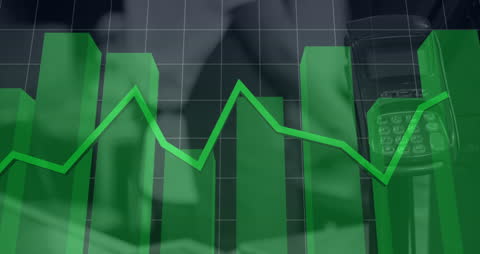
Vibrant green bars overlayed with a dynamic line graph create a visual representation of statistical data, showing economic or financial trends. Useful for themes related to business analytics, market research, finance, and economic growth projections. Ideal for use in presentations, reports, and websites focused on data visualization, statistics, and financial forecasting.
Powered by 


downloads
Tags:
More
Credit Photo
If you would like to credit the Photo, here are some ways you can do so
Text Link
video Link
<span class="text-link">
<span>
<a target="_blank" href=https://pikwizard.com/video/dynamic-green-bar-graph-with-statistical-trends/12a3764019aa813593c2c12faac70f34/>PikWizard</a>
</span>
</span>
<span class="image-link">
<span
style="margin: 0 0 20px 0; display: inline-block; vertical-align: middle; width: 100%;"
>
<a
target="_blank"
href="https://pikwizard.com/video/dynamic-green-bar-graph-with-statistical-trends/12a3764019aa813593c2c12faac70f34/"
style="text-decoration: none; font-size: 10px; margin: 0;"
>
<video controls style="width: 100%; margin: 0;">
<source src="https://player.vimeo.com/progressive_redirect/playback/717429907/rendition/240p/file.mp4?loc=external&oauth2_token_id=1223210874&signature=7cdeeaf498f0e0d0cd05af158af5d3fd7581813da5c76af2d9d7b7012b49071b" type="video/mp4"
poster="https://pikwizard.com/pw/medium/12a3764019aa813593c2c12faac70f34.jpg"/>
Your browser does not support the video tag.
</video>
<p style="font-size: 12px; margin: 0;">PikWizard</p>
</a>
</span>
</span>
Free (free of charge)
Free for personal and commercial use.
Author: Awesome Content