
- Home >
- Stock Videos >
- Dynamic Infographic with Animated Data Charts and Graphs
Dynamic Infographic with Animated Data Charts and Graphs Video
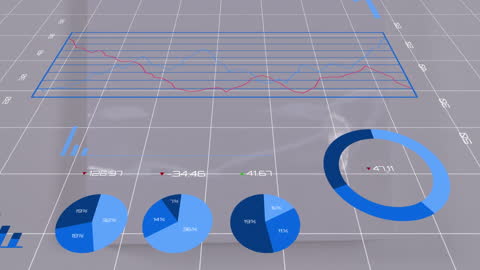
Creative infographic illustrating changing financial data via various animated charts and graphs on a grid pattern. Blue tones dominate the visual, portraying pie charts, line graphs, and percentage data, offering a sleek and organized appearance. Suitable for presentations, educational materials pertaining to finance or data management, and infographics. Useful for audiences interested in professional or business analytics and data report illustration.

downloads
Tags:
More
Credit Photo
If you would like to credit the Photo, here are some ways you can do so
Text Link
video Link
<span class="text-link">
<span>
<a target="_blank" href=https://pikwizard.com/video/dynamic-infographic-with-animated-data-charts-and-graphs/944750e2aa9dcb96044bdcae267e190d/>PikWizard</a>
</span>
</span>
<span class="image-link">
<span
style="margin: 0 0 20px 0; display: inline-block; vertical-align: middle; width: 100%;"
>
<a
target="_blank"
href="https://pikwizard.com/video/dynamic-infographic-with-animated-data-charts-and-graphs/944750e2aa9dcb96044bdcae267e190d/"
style="text-decoration: none; font-size: 10px; margin: 0;"
>
<video controls style="width: 100%; margin: 0;">
<source src="https://player.vimeo.com/progressive_redirect/playback/798412982/rendition/240p/file.mp4?loc=external&oauth2_token_id=1223210874&signature=26d5c076447f1fa2611d6be4ac075f31cae023516339672b956dd3647ed74898" type="video/mp4"
poster="https://pikwizard.com/pw/medium/944750e2aa9dcb96044bdcae267e190d.jpg"/>
Your browser does not support the video tag.
</video>
<p style="font-size: 12px; margin: 0;">PikWizard</p>
</a>
</span>
</span>
Free (free of charge)
Free for personal and commercial use.
Author: Awesome Content