
- Home >
- Stock Videos >
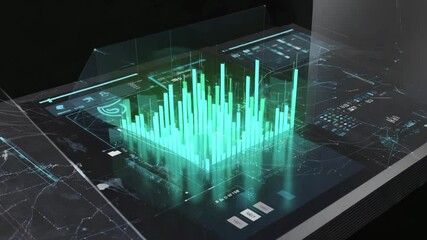
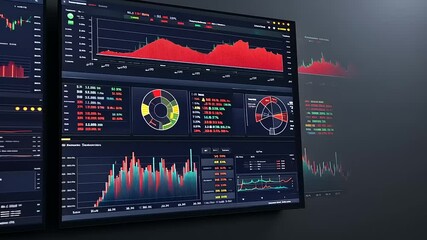
- Dynamic Interface Displaying Real-Time Market Trends with Neon Analytics
Dynamic Interface Displaying Real-Time Market Trends with Neon Analytics Video

AI
AI Generated Video. Futuristic digital interface panels showcase live trading and market trends through neon lines and numeric updates. This vibrant visualization is ideal for illustrating all aspects of technology-driven financial monitoring and agile decision making. It can effectively be utilized in presentations about trends in data visualization, AI's role in analytics, or modern innovative techniques within stock trading environments.
Powered by 


downloads
Tags:
More
Credit Photo
If you would like to credit the Photo, here are some ways you can do so
Text Link
video Link
<span class="text-link">
<span>
<a target="_blank" href=https://pikwizard.com/video/dynamic-interface-displaying-real-time-market-trends-with-neon-analytics/9e8436b353391a9fa5262d6817da933c/>PikWizard</a>
</span>
</span>
<span class="image-link">
<span
style="margin: 0 0 20px 0; display: inline-block; vertical-align: middle; width: 100%;"
>
<a
target="_blank"
href="https://pikwizard.com/video/dynamic-interface-displaying-real-time-market-trends-with-neon-analytics/9e8436b353391a9fa5262d6817da933c/"
style="text-decoration: none; font-size: 10px; margin: 0;"
>
<video controls style="width: 100%; margin: 0;">
<source src="https://player.vimeo.com/progressive_redirect/playback/1097860637/rendition/240p/file.mp4?loc=external&oauth2_token_id=1223210874&signature=f14431c63fc86755f8451a937b6ea83c1e10ba22cfbf6f6dfd3ada91c84f63aa" type="video/mp4"
poster="https://pikwizard.com/pw/medium/9e8436b353391a9fa5262d6817da933c.jpg"/>
Your browser does not support the video tag.
</video>
<p style="font-size: 12px; margin: 0;">PikWizard</p>
</a>
</span>
</span>
Free (free of charge)
Free for personal and commercial use.
Author: Awesome Content