
- Home >
- Stock Videos >
- Dynamic Line Graph Animation with Financial Analytics Data
Dynamic Line Graph Animation with Financial Analytics Data Video
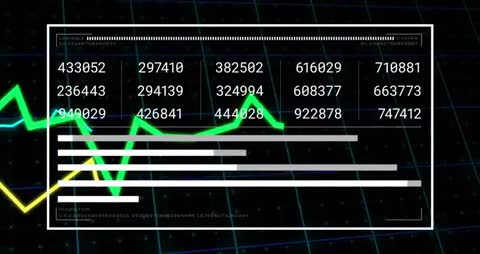
Bright green line graph showing fluctuating numerical data on a digital grid pattern, ideal for presentations about finance, analytics, technology, business trends, and economic statistics.

downloads
Tags:
More
Credit Photo
If you would like to credit the Photo, here are some ways you can do so
Text Link
video Link
<span class="text-link">
<span>
<a target="_blank" href=https://pikwizard.com/video/dynamic-line-graph-animation-with-financial-analytics-data/d65c640614aceb24a8ba5ba3bb77d21b/>PikWizard</a>
</span>
</span>
<span class="image-link">
<span
style="margin: 0 0 20px 0; display: inline-block; vertical-align: middle; width: 100%;"
>
<a
target="_blank"
href="https://pikwizard.com/video/dynamic-line-graph-animation-with-financial-analytics-data/d65c640614aceb24a8ba5ba3bb77d21b/"
style="text-decoration: none; font-size: 10px; margin: 0;"
>
<video controls style="width: 100%; margin: 0;">
<source src="https://player.vimeo.com/progressive_redirect/playback/1063720401/rendition/240p/file.mp4?loc=external&oauth2_token_id=1223210874&signature=1fb48ebb3d594b46fabe0672a2477072a49a1aed0a205f912a522ab852d51855&user_id=91254407" type="video/mp4"
poster="https://pikwizard.com/pw/medium/d65c640614aceb24a8ba5ba3bb77d21b.jpg"/>
Your browser does not support the video tag.
</video>
<p style="font-size: 12px; margin: 0;">PikWizard</p>
</a>
</span>
</span>
Free (free of charge)
Free for personal and commercial use.
Author: Awesome Content