
- Home >
- Stock Videos >
- Dynamic Red Graph Decline with Data Visualizations
Dynamic Red Graph Decline with Data Visualizations Video
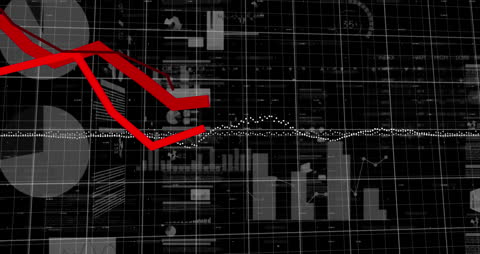
Visually represents declining financial data through red graph lines, set against a digital background with various charts and graphs. Ideal for use in financial reports, market analysis websites, economic trend presentations, and educational materials about data processing and analysis in finance.
Powered by  - Get 15% off with code: PIKWIZARD15


downloads
Tags:
More
Credit Photo
If you would like to credit the Photo, here are some ways you can do so
Text Link
video Link
<span class="text-link">
<span>
<a target="_blank" href=https://pikwizard.com/video/dynamic-red-graph-decline-with-data-visualizations/a16e8b40a0c5b5b5b8175f8c5cc5d682/>PikWizard</a>
</span>
</span>
<span class="image-link">
<span
style="margin: 0 0 20px 0; display: inline-block; vertical-align: middle; width: 100%;"
>
<a
target="_blank"
href="https://pikwizard.com/video/dynamic-red-graph-decline-with-data-visualizations/a16e8b40a0c5b5b5b8175f8c5cc5d682/"
style="text-decoration: none; font-size: 10px; margin: 0;"
>
<video controls style="width: 100%; margin: 0;">
<source src="https://player.vimeo.com/progressive_redirect/playback/770946933/rendition/240p/file.mp4?loc=external&oauth2_token_id=1223210874&signature=87e2d9c199ec3faeb1a76c3f811654fe40a19b4e2846b09d0bf7f9e0f9934d7d" type="video/mp4"
poster="https://pikwizard.com/pw/medium/a16e8b40a0c5b5b5b8175f8c5cc5d682.jpg"/>
Your browser does not support the video tag.
</video>
<p style="font-size: 12px; margin: 0;">PikWizard</p>
</a>
</span>
</span>
Free (free of charge)
Free for personal and commercial use.
Author: Awesome Content