
- Home >
- Stock Videos >
- Dynamic Stock Exchange Display with Tech Interface Graphics
Dynamic Stock Exchange Display with Tech Interface Graphics Video
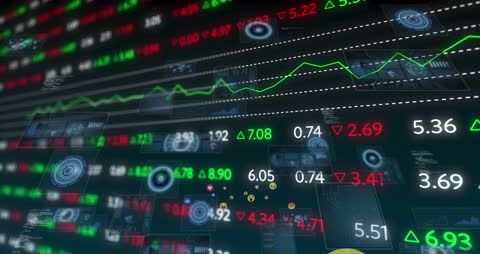
Depicts a vibrant electronic stock market display board filled with fluctuating graphs and dynamic numbers, representing active trading. Slick digital interfaces superimpose on the board, symbolizing advanced technology. Suitable for illustrating concepts related to global finance, digital trading systems, economic analysis, and real-time data processing.
Powered by 


downloads
Tags:
More
Credit Photo
If you would like to credit the Photo, here are some ways you can do so
Text Link
video Link
<span class="text-link">
<span>
<a target="_blank" href=https://pikwizard.com/video/dynamic-stock-exchange-display-with-tech-interface-graphics/f590af37474aea167d7cd212a5a134b1/>PikWizard</a>
</span>
</span>
<span class="image-link">
<span
style="margin: 0 0 20px 0; display: inline-block; vertical-align: middle; width: 100%;"
>
<a
target="_blank"
href="https://pikwizard.com/video/dynamic-stock-exchange-display-with-tech-interface-graphics/f590af37474aea167d7cd212a5a134b1/"
style="text-decoration: none; font-size: 10px; margin: 0;"
>
<video controls style="width: 100%; margin: 0;">
<source src="https://player.vimeo.com/progressive_redirect/playback/798588641/rendition/240p/file.mp4?loc=external&oauth2_token_id=1223210874&signature=f8a5af4f7c29be31ce0c8a8cbd1fe6e3aa76d0e82a4c99f67fbc9c0ef5984e82" type="video/mp4"
poster="https://pikwizard.com/pw/medium/f590af37474aea167d7cd212a5a134b1.jpg"/>
Your browser does not support the video tag.
</video>
<p style="font-size: 12px; margin: 0;">PikWizard</p>
</a>
</span>
</span>
Free (free of charge)
Free for personal and commercial use.
Author: Awesome Content