
- Home >
- Stock Videos >
- Dynamic Stock Market Analysis with Red Time Lapse Graph Overlay
Dynamic Stock Market Analysis with Red Time Lapse Graph Overlay Video
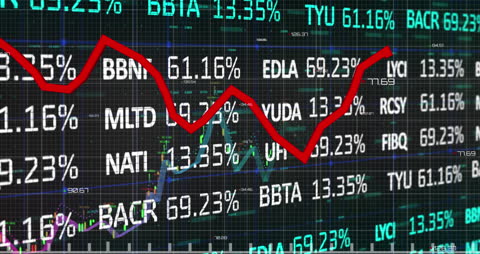
Digital representation of stock market data processing, featuring a red graph overlay on fluctuating numbers, highlights dynamic analysis for business and finance presentations. Useful for financial reports, educational content on market trends, and corporate digital platforms.
Powered by 


1
downloads
downloads
Tags:
More
Credit Photo
If you would like to credit the Photo, here are some ways you can do so
Text Link
video Link
<span class="text-link">
<span>
<a target="_blank" href=https://pikwizard.com/video/dynamic-stock-market-analysis-with-red-time-lapse-graph-overlay/dae3e4fa246934b24b415f168318607f/>PikWizard</a>
</span>
</span>
<span class="image-link">
<span
style="margin: 0 0 20px 0; display: inline-block; vertical-align: middle; width: 100%;"
>
<a
target="_blank"
href="https://pikwizard.com/video/dynamic-stock-market-analysis-with-red-time-lapse-graph-overlay/dae3e4fa246934b24b415f168318607f/"
style="text-decoration: none; font-size: 10px; margin: 0;"
>
<video controls style="width: 100%; margin: 0;">
<source src="https://player.vimeo.com/progressive_redirect/playback/718916178/rendition/240p/file.mp4?loc=external&oauth2_token_id=1223210874&signature=ca6847819aa4989057191ffb21d55f740c2a153458dbde18f0f073204c94cab6" type="video/mp4"
poster="https://pikwizard.com/pw/medium/dae3e4fa246934b24b415f168318607f.jpg"/>
Your browser does not support the video tag.
</video>
<p style="font-size: 12px; margin: 0;">PikWizard</p>
</a>
</span>
</span>
Free (free of charge)
Free for personal and commercial use.
Author: Awesome Content