
- Home >
- Stock Videos >
- Dynamic Stock Market Analytics with Rising Graphs and Data
Dynamic Stock Market Analytics with Rising Graphs and Data Video
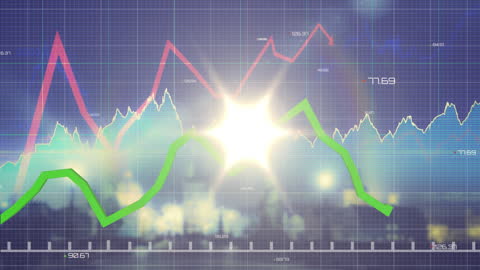
An abstract representation of stock market analytics featuring vibrant green and red graphs against a blurry cityscape background. This illustration symbolizes economic trends and financial insights. Useful for articles, presentations, or reports on finance, investment strategies, and market analysis.
Powered by  - Get 15% off with code: PIKWIZARD15


downloads
Tags:
More
Credit Photo
If you would like to credit the Photo, here are some ways you can do so
Text Link
video Link
<span class="text-link">
<span>
<a target="_blank" href=https://pikwizard.com/video/dynamic-stock-market-analytics-with-rising-graphs-and-data/d7850f34e1f75c7e4fc31934bc42eb8d/>PikWizard</a>
</span>
</span>
<span class="image-link">
<span
style="margin: 0 0 20px 0; display: inline-block; vertical-align: middle; width: 100%;"
>
<a
target="_blank"
href="https://pikwizard.com/video/dynamic-stock-market-analytics-with-rising-graphs-and-data/d7850f34e1f75c7e4fc31934bc42eb8d/"
style="text-decoration: none; font-size: 10px; margin: 0;"
>
<video controls style="width: 100%; margin: 0;">
<source src="https://player.vimeo.com/progressive_redirect/playback/758933499/rendition/360p/file.mp4?loc=external&oauth2_token_id=1223210874&signature=c7848e7a861263a69ed60c480df22be56eae57bf6179071f6ca4b088ae7fdcf6" type="video/mp4"
poster="https://pikwizard.com/pw/medium/d7850f34e1f75c7e4fc31934bc42eb8d.jpg"/>
Your browser does not support the video tag.
</video>
<p style="font-size: 12px; margin: 0;">PikWizard</p>
</a>
</span>
</span>
Free (free of charge)
Free for personal and commercial use.
Author: Awesome Content