
- Home >
- Stock Videos >
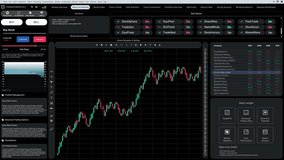
- Dynamic Stock Market Dashboard Display with Falling Data and Red Indicators
Dynamic Stock Market Dashboard Display with Falling Data and Red Indicators Video

AI Generated Image. This AI-generated video depicts a detailed trading screen focusing on finance and investment analytics. With vibrant displays showing a variety of stocks plunging, and red-colored indicators symbolizing a market decline, it emphasizes real-time data visualization crucial for traders and investors. Suitable for illustrating market, business, stock analysis practices, or finance-related articles, showcasing economic trends or teaching financial literacy and live tracking.
Powered by  - Get 15% off with code: PIKWIZARD15


0
downloads
downloads
Tags:
More
Credit Photo
If you would like to credit the Photo, here are some ways you can do so
Text Link
video Link
<span class="text-link">
<span>
<a target="_blank" href=https://pikwizard.com/video/dynamic-stock-market-dashboard-display-with-falling-data-and-red-indicators/c830f991d81fee8fde0d5d8435ff5493/>PikWizard</a>
</span>
</span>
<span class="image-link">
<span
style="margin: 0 0 20px 0; display: inline-block; vertical-align: middle; width: 100%;"
>
<a
target="_blank"
href="https://pikwizard.com/video/dynamic-stock-market-dashboard-display-with-falling-data-and-red-indicators/c830f991d81fee8fde0d5d8435ff5493/"
style="text-decoration: none; font-size: 10px; margin: 0;"
>
<video controls style="width: 100%; margin: 0;">
<source src="https://player.vimeo.com/progressive_redirect/playback/1097860603/rendition/240p/file.mp4?loc=external&oauth2_token_id=1223210874&signature=b97e5d24dda61d989f6f8c0d9a5dc0cfc7605e8b64ef448f5ed13312b9fd4cb5" type="video/mp4"
poster="https://pikwizard.com/pw/medium/c830f991d81fee8fde0d5d8435ff5493.jpg"/>
Your browser does not support the video tag.
</video>
<p style="font-size: 12px; margin: 0;">PikWizard</p>
</a>
</span>
</span>
Free (free of charge)
Free for personal and commercial use.
Author: AI Creator