
- Home >
- Stock Videos >
- Dynamic Stock Market Data and Financial Growth Chart
Dynamic Stock Market Data and Financial Growth Chart Video
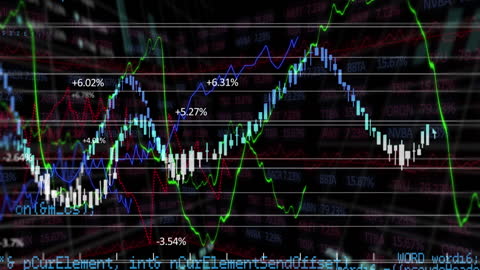
Captures dynamic stock market and financial data in a digital simulation with various graphs depicting growth rates and trends. Used for financial analytics presentations, investment strategy development, or economic research reports to illustrate market trends and fluctuations.
Powered by  - Get 15% off with code: PIKWIZARD15


1
downloads
downloads
Tags:
More
Credit Photo
If you would like to credit the Photo, here are some ways you can do so
Text Link
video Link
<span class="text-link">
<span>
<a target="_blank" href=https://pikwizard.com/video/dynamic-stock-market-data-and-financial-growth-chart/e00dc8220cf1a6efd83e2ffdfa7bd7ed/>PikWizard</a>
</span>
</span>
<span class="image-link">
<span
style="margin: 0 0 20px 0; display: inline-block; vertical-align: middle; width: 100%;"
>
<a
target="_blank"
href="https://pikwizard.com/video/dynamic-stock-market-data-and-financial-growth-chart/e00dc8220cf1a6efd83e2ffdfa7bd7ed/"
style="text-decoration: none; font-size: 10px; margin: 0;"
>
<video controls style="width: 100%; margin: 0;">
<source src="https://player.vimeo.com/progressive_redirect/playback/718740193/rendition/240p/file.mp4?loc=external&oauth2_token_id=1223210874&signature=916cdb8b0db57492f1eb0a7ab9a7dbbf3674d314c8b78f235f7f5904a9d3fc62" type="video/mp4"
poster="https://pikwizard.com/pw/medium/e00dc8220cf1a6efd83e2ffdfa7bd7ed.jpg"/>
Your browser does not support the video tag.
</video>
<p style="font-size: 12px; margin: 0;">PikWizard</p>
</a>
</span>
</span>
Free (free of charge)
Free for personal and commercial use.
Author: Awesome Content