
- Home >
- Stock Videos >
- Dynamic Stock Market Data Display with Declining Trend Line
Dynamic Stock Market Data Display with Declining Trend Line Video
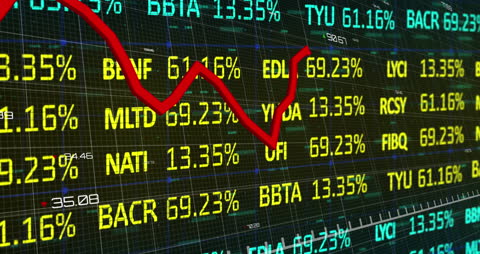
Statistics and numbers fill the screen, highlighting various stock performances, while a prominent red line illustrates a negative trend. This visual serves as a notable representation of a bearish market phase, making it suitable for articles or presentations about financial downturns, market analysis methods, or investment strategies under volatile conditions.
Powered by 


downloads
Tags:
More
Credit Photo
If you would like to credit the Photo, here are some ways you can do so
Text Link
video Link
<span class="text-link">
<span>
<a target="_blank" href=https://pikwizard.com/video/dynamic-stock-market-data-display-with-declining-trend-line/71ac45fcd05e63a6f0c541bdf911aca2/>PikWizard</a>
</span>
</span>
<span class="image-link">
<span
style="margin: 0 0 20px 0; display: inline-block; vertical-align: middle; width: 100%;"
>
<a
target="_blank"
href="https://pikwizard.com/video/dynamic-stock-market-data-display-with-declining-trend-line/71ac45fcd05e63a6f0c541bdf911aca2/"
style="text-decoration: none; font-size: 10px; margin: 0;"
>
<video controls style="width: 100%; margin: 0;">
<source src="https://player.vimeo.com/progressive_redirect/playback/717562923/rendition/240p/file.mp4?loc=external&oauth2_token_id=1223210874&signature=79e6da5d259852293c58ef834842f61dd3b12b85b97921aff8d81755cb0ca60f" type="video/mp4"
poster="https://pikwizard.com/pw/medium/71ac45fcd05e63a6f0c541bdf911aca2.jpg"/>
Your browser does not support the video tag.
</video>
<p style="font-size: 12px; margin: 0;">PikWizard</p>
</a>
</span>
</span>
Free (free of charge)
Free for personal and commercial use.
Author: Awesome Content