
- Home >
- Stock Videos >
- Dynamic Stock Market Data Visualisation on Digital Screen
Dynamic Stock Market Data Visualisation on Digital Screen Video
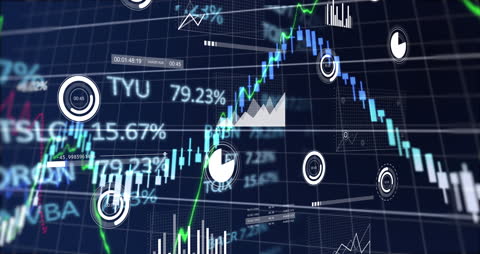
Complex visual overlaying depicting stock market data offers a dynamic representation of financial analysis and technology. Useful for presentations on investing, economics, or finance technologies, showcasing real-time business, or intended for an audience following market trends closely. Engaging for both financial consultants and technology instructors demonstrating financial systems.

downloads
Tags:
More
Credit Photo
If you would like to credit the Photo, here are some ways you can do so
Text Link
video Link
<span class="text-link">
<span>
<a target="_blank" href=https://pikwizard.com/video/dynamic-stock-market-data-visualisation-on-digital-screen/64861743838275ab50e5c74cfb35b70a/>PikWizard</a>
</span>
</span>
<span class="image-link">
<span
style="margin: 0 0 20px 0; display: inline-block; vertical-align: middle; width: 100%;"
>
<a
target="_blank"
href="https://pikwizard.com/video/dynamic-stock-market-data-visualisation-on-digital-screen/64861743838275ab50e5c74cfb35b70a/"
style="text-decoration: none; font-size: 10px; margin: 0;"
>
<video controls style="width: 100%; margin: 0;">
<source src="https://player.vimeo.com/progressive_redirect/playback/828225958/rendition/240p/file.mp4?loc=external&oauth2_token_id=1223210874&signature=318a7d63e1141c27873dae3c64c13ce84c1fc356a31fe4661cc8709c2950dea5" type="video/mp4"
poster="https://pikwizard.com/pw/medium/64861743838275ab50e5c74cfb35b70a.jpg"/>
Your browser does not support the video tag.
</video>
<p style="font-size: 12px; margin: 0;">PikWizard</p>
</a>
</span>
</span>
Free (free of charge)
Free for personal and commercial use.
Author: Awesome Content