
- Home >
- Stock Videos >
- Dynamic Stock Market DataVisualizer Chart
Dynamic Stock Market DataVisualizer Chart Video
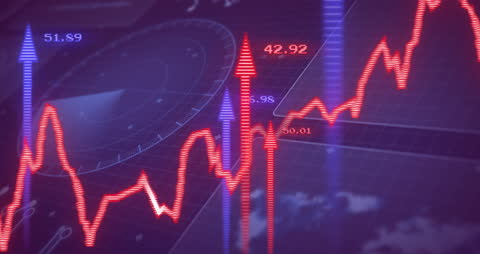
This video illustrates a high-tech data visualization featuring animated elements and arrows representing stock market fluctuations. Ideal for use in presentations on finance, technology, and economic forecasting, this dynamic video can be effectively utilized in marketing materials, educational content, or financial reports to convey concepts related to stock markets and digital data analysis.

downloads
Tags:
More
Credit Photo
If you would like to credit the Photo, here are some ways you can do so
Text Link
video Link
<span class="text-link">
<span>
<a target="_blank" href=https://pikwizard.com/video/dynamic-stock-market-datavisualizer-chart/2718b37828b3f7e19c1be90bbef7e135/>PikWizard</a>
</span>
</span>
<span class="image-link">
<span
style="margin: 0 0 20px 0; display: inline-block; vertical-align: middle; width: 100%;"
>
<a
target="_blank"
href="https://pikwizard.com/video/dynamic-stock-market-datavisualizer-chart/2718b37828b3f7e19c1be90bbef7e135/"
style="text-decoration: none; font-size: 10px; margin: 0;"
>
<video controls style="width: 100%; margin: 0;">
<source src="https://player.vimeo.com/progressive_redirect/playback/790156078/rendition/240p/file.mp4?loc=external&oauth2_token_id=1223210874&signature=79d2dcce83e8147b3c9d71baaf9bc6c5b838870b38c027f56caf4acaf9ff2434" type="video/mp4"
poster="https://pikwizard.com/pw/medium/2718b37828b3f7e19c1be90bbef7e135.jpg"/>
Your browser does not support the video tag.
</video>
<p style="font-size: 12px; margin: 0;">PikWizard</p>
</a>
</span>
</span>
Free (free of charge)
Free for personal and commercial use.
Author: Awesome Content