
- Home >
- Stock Videos >
- Dynamic Stock Market Display with Financial Graphs and Tickers
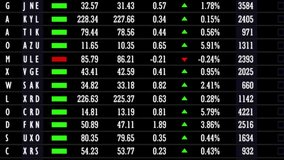
Dynamic Stock Market Display with Financial Graphs and Tickers Video
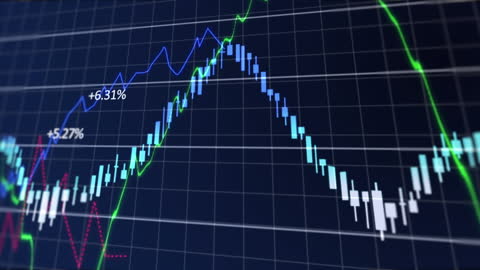
Vibrant digital display showcasing various stock market indicators with colored graph lines presenting market fluctuations and analysis. Useful for finance-related projects, business presentations, educational material, or news reports exploring economic impacts and financial market dynamics.
Powered by  - Get 15% off with code: PIKWIZARD15


1
downloads
downloads
Tags:
More
Credit Photo
If you would like to credit the Photo, here are some ways you can do so
Text Link
video Link
<span class="text-link">
<span>
<a target="_blank" href=https://pikwizard.com/video/dynamic-stock-market-display-with-financial-graphs-and-tickers/a09376acec4357a01c9d762a59d42ce5/>PikWizard</a>
</span>
</span>
<span class="image-link">
<span
style="margin: 0 0 20px 0; display: inline-block; vertical-align: middle; width: 100%;"
>
<a
target="_blank"
href="https://pikwizard.com/video/dynamic-stock-market-display-with-financial-graphs-and-tickers/a09376acec4357a01c9d762a59d42ce5/"
style="text-decoration: none; font-size: 10px; margin: 0;"
>
<video controls style="width: 100%; margin: 0;">
<source src="https://player.vimeo.com/progressive_redirect/playback/806113739/rendition/240p/file.mp4?loc=external&oauth2_token_id=1223210874&signature=832975187181e3df67e4b9cfd15710d7d27a476b10d990dbf12c0e7e81cf56bd" type="video/mp4"
poster="https://pikwizard.com/pw/medium/a09376acec4357a01c9d762a59d42ce5.jpg"/>
Your browser does not support the video tag.
</video>
<p style="font-size: 12px; margin: 0;">PikWizard</p>
</a>
</span>
</span>
Free (free of charge)
Free for personal and commercial use.
Author: Awesome Content