
- Home >
- Stock Videos >
- Dynamic Stock Market Visualization with Ocean Waves
Dynamic Stock Market Visualization with Ocean Waves Video
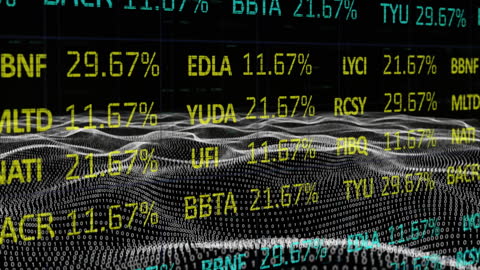
This video vividly portrays a futuristic blend of stock market data displayed as a holographic screen above digital ocean waves. Ideal for use in finance-related presentations, blogs, or articles that explore stock market trends, investment strategies, or financial technology innovations. The juxtaposition of water and data signifies fluidity and the dynamic nature of financial markets.
Powered by  - Get 15% off with code: PIKWIZARD15


downloads
Tags:
More
Credit Photo
If you would like to credit the Photo, here are some ways you can do so
Text Link
video Link
<span class="text-link">
<span>
<a target="_blank" href=https://pikwizard.com/video/dynamic-stock-market-visualization-with-ocean-waves/5345c71b469e1f63e1db00b4cffbb840/>PikWizard</a>
</span>
</span>
<span class="image-link">
<span
style="margin: 0 0 20px 0; display: inline-block; vertical-align: middle; width: 100%;"
>
<a
target="_blank"
href="https://pikwizard.com/video/dynamic-stock-market-visualization-with-ocean-waves/5345c71b469e1f63e1db00b4cffbb840/"
style="text-decoration: none; font-size: 10px; margin: 0;"
>
<video controls style="width: 100%; margin: 0;">
<source src="https://player.vimeo.com/progressive_redirect/playback/908417237/rendition/240p/file.mp4?loc=external&oauth2_token_id=1223210874&signature=b62fc7aba793a4284fd4a3428bba48ca77a5613b660832050b021e4a373665df" type="video/mp4"
poster="https://pikwizard.com/pw/medium/5345c71b469e1f63e1db00b4cffbb840.jpg"/>
Your browser does not support the video tag.
</video>
<p style="font-size: 12px; margin: 0;">PikWizard</p>
</a>
</span>
</span>
Free (free of charge)
Free for personal and commercial use.
Author: Awesome Content