
- Home >
- Stock Videos >
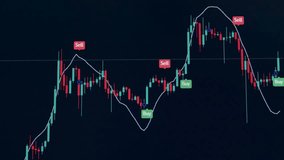
- Dynamic Stock Market Visualization with Real-Time Data Indicators
Dynamic Stock Market Visualization with Real-Time Data Indicators Video

AI
AI Generated Video. Live updating candlestick chart with vibrant colors, representing market trends and investment activities. Ideal for illustrating dynamic trading strategies, financial blog posts, presentations on market analytics, or economic classrooms for studying live market behaviors. Showcase advanced technology and AI-driven financial analysis tools.
Powered by  - Get 15% off with code: PIKWIZARD15


downloads
Tags:
More
Credit Photo
If you would like to credit the Photo, here are some ways you can do so
Text Link
video Link
<span class="text-link">
<span>
<a target="_blank" href=https://pikwizard.com/video/dynamic-stock-market-visualization-with-real-time-data-indicators/b0e81b5021010cfbf56cd843e9b28b47/>PikWizard</a>
</span>
</span>
<span class="image-link">
<span
style="margin: 0 0 20px 0; display: inline-block; vertical-align: middle; width: 100%;"
>
<a
target="_blank"
href="https://pikwizard.com/video/dynamic-stock-market-visualization-with-real-time-data-indicators/b0e81b5021010cfbf56cd843e9b28b47/"
style="text-decoration: none; font-size: 10px; margin: 0;"
>
<video controls style="width: 100%; margin: 0;">
<source src="https://player.vimeo.com/progressive_redirect/playback/1097860944/rendition/240p/file.mp4?loc=external&oauth2_token_id=1223210874&signature=e781bf811163008132e041b3d8a7c2335c3154e657fd6aee01f20889e2f6085c" type="video/mp4"
poster="https://pikwizard.com/pw/medium/b0e81b5021010cfbf56cd843e9b28b47.jpg"/>
Your browser does not support the video tag.
</video>
<p style="font-size: 12px; margin: 0;">PikWizard</p>
</a>
</span>
</span>
Free (free of charge)
Free for personal and commercial use.
Author: AI Creator