
- Home >
- Stock Videos >
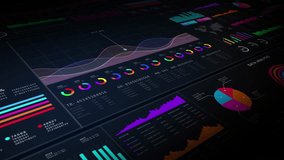
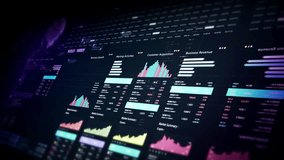
- Dynamic Visualization of Digital Financial Data Analytics
Dynamic Visualization of Digital Financial Data Analytics Video
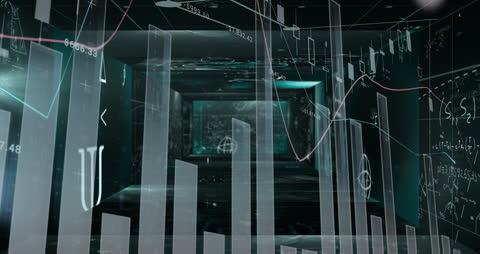
This digital animation presents a futuristic visualization of financial data processing, highlighting trends through dynamic graphs, charts, and digital analytics. Great for use in finance and technology presentations, economic reports, digital transformation strategies, and as background videory in corporate or tech industry projects to illustrate the concept of advanced digital integration in financial analytics.
Powered by  - Get 15% off with code: PIKWIZARD15


downloads
Tags:
More
Credit Photo
If you would like to credit the Photo, here are some ways you can do so
Text Link
video Link
<span class="text-link">
<span>
<a target="_blank" href=https://pikwizard.com/video/dynamic-visualization-of-digital-financial-data-analytics/da5a9705da3c2eddb62df38203b4c503/>PikWizard</a>
</span>
</span>
<span class="image-link">
<span
style="margin: 0 0 20px 0; display: inline-block; vertical-align: middle; width: 100%;"
>
<a
target="_blank"
href="https://pikwizard.com/video/dynamic-visualization-of-digital-financial-data-analytics/da5a9705da3c2eddb62df38203b4c503/"
style="text-decoration: none; font-size: 10px; margin: 0;"
>
<video controls style="width: 100%; margin: 0;">
<source src="https://player.vimeo.com/progressive_redirect/playback/718546542/rendition/240p/file.mp4?loc=external&oauth2_token_id=1223210874&signature=cc020035712116208759891471d8682505d5f6e46840ecccfa3b85944c10a1b6" type="video/mp4"
poster="https://pikwizard.com/pw/medium/da5a9705da3c2eddb62df38203b4c503.jpg"/>
Your browser does not support the video tag.
</video>
<p style="font-size: 12px; margin: 0;">PikWizard</p>
</a>
</span>
</span>
Free (free of charge)
Free for personal and commercial use.
Author: Awesome Content