
- Home >
- Stock Videos >
- Dynamic Visualization of Financial Market Analysis and Data
Dynamic Visualization of Financial Market Analysis and Data Video
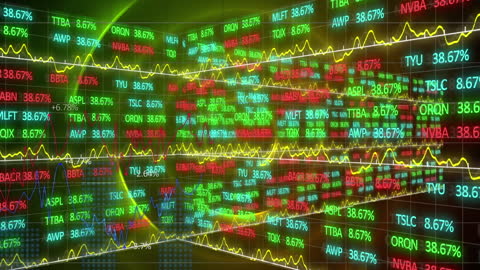
Displaying animated financial data, illustrating stock market trends and real-time analysis. Perfect for use in presentations related to finance, investments, and economic forecasting. Ideal for showcasing market activity in news segments or financial reports.
Powered by 


downloads
Tags:
More
Credit Photo
If you would like to credit the Photo, here are some ways you can do so
Text Link
video Link
<span class="text-link">
<span>
<a target="_blank" href=https://pikwizard.com/video/dynamic-visualization-of-financial-market-analysis-and-data/ced51bed697c0fbc7c8a63797a837b75/>PikWizard</a>
</span>
</span>
<span class="image-link">
<span
style="margin: 0 0 20px 0; display: inline-block; vertical-align: middle; width: 100%;"
>
<a
target="_blank"
href="https://pikwizard.com/video/dynamic-visualization-of-financial-market-analysis-and-data/ced51bed697c0fbc7c8a63797a837b75/"
style="text-decoration: none; font-size: 10px; margin: 0;"
>
<video controls style="width: 100%; margin: 0;">
<source src="https://player.vimeo.com/progressive_redirect/playback/911373808/rendition/240p/file.mp4?loc=external&oauth2_token_id=1223210874&signature=5101b7d10117aa989f848347d0514f5f411af8146e49e30a657c96055e6e2e9f" type="video/mp4"
poster="https://pikwizard.com/pw/medium/ced51bed697c0fbc7c8a63797a837b75.jpg"/>
Your browser does not support the video tag.
</video>
<p style="font-size: 12px; margin: 0;">PikWizard</p>
</a>
</span>
</span>
Free (free of charge)
Free for personal and commercial use.
Author: Awesome Content