
- Home >
- Stock Videos >
- Dynamic Visualization of Global Financial Data Analysis
Dynamic Visualization of Global Financial Data Analysis Video
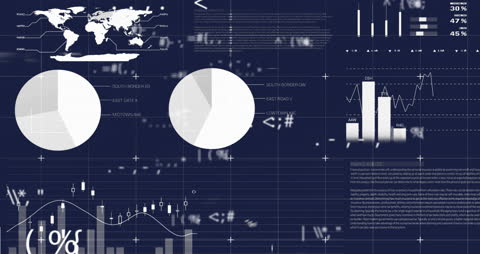
Graphic illustrating financial charts and data analytics involves motion-style visuals, emphasizing global business connections. Useful for financial industry presentations, economic reports, educational resources on market trends, or business intelligence tools.
Powered by 


downloads
Tags:
More
Credit Photo
If you would like to credit the Photo, here are some ways you can do so
Text Link
video Link
<span class="text-link">
<span>
<a target="_blank" href=https://pikwizard.com/video/dynamic-visualization-of-global-financial-data-analysis/c166e6574612c7bd42dfedcea8cb6c17/>PikWizard</a>
</span>
</span>
<span class="image-link">
<span
style="margin: 0 0 20px 0; display: inline-block; vertical-align: middle; width: 100%;"
>
<a
target="_blank"
href="https://pikwizard.com/video/dynamic-visualization-of-global-financial-data-analysis/c166e6574612c7bd42dfedcea8cb6c17/"
style="text-decoration: none; font-size: 10px; margin: 0;"
>
<video controls style="width: 100%; margin: 0;">
<source src="https://player.vimeo.com/progressive_redirect/playback/907875542/rendition/240p/file.mp4?loc=external&oauth2_token_id=1223210874&signature=3570714fbd50600f09b2875e3f8d358a5127b7d8adb205ef97d4db9723bec7e7" type="video/mp4"
poster="https://pikwizard.com/pw/medium/c166e6574612c7bd42dfedcea8cb6c17.jpg"/>
Your browser does not support the video tag.
</video>
<p style="font-size: 12px; margin: 0;">PikWizard</p>
</a>
</span>
</span>
Free (free of charge)
Free for personal and commercial use.
Author: Awesome Content