
- Home >
- Stock Videos >
- Dynamic Visualization of Global Financial Data Overlaying Stock Market Trends
Dynamic Visualization of Global Financial Data Overlaying Stock Market Trends Video

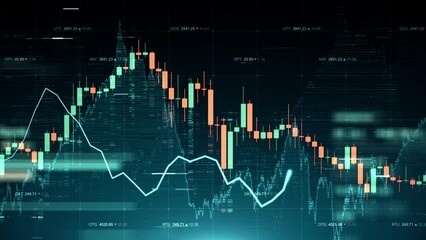
This dynamic video depicts the integration of financial data overlaid with stock market trends, illustrating patterns and analytics valuable for investors and market analysts. Use it for presentations on market dynamics, financial analysis, economic forecasting, or showcasing financial technologies.
Powered by 


1
downloads
downloads
Tags:
More
Credit Photo
If you would like to credit the Photo, here are some ways you can do so
Text Link
video Link
<span class="text-link">
<span>
<a target="_blank" href=https://pikwizard.com/video/dynamic-visualization-of-global-financial-data-overlaying-stock-market-trends/d6c34ebcd12c12847d9a59c6781ed001/>PikWizard</a>
</span>
</span>
<span class="image-link">
<span
style="margin: 0 0 20px 0; display: inline-block; vertical-align: middle; width: 100%;"
>
<a
target="_blank"
href="https://pikwizard.com/video/dynamic-visualization-of-global-financial-data-overlaying-stock-market-trends/d6c34ebcd12c12847d9a59c6781ed001/"
style="text-decoration: none; font-size: 10px; margin: 0;"
>
<video controls style="width: 100%; margin: 0;">
<source src="https://player.vimeo.com/progressive_redirect/playback/736539910/rendition/240p/file.mp4?loc=external&oauth2_token_id=1223210874&signature=ee4396c0617c351c36f63a2a52b560d092ad946091b4a54b89c2b711f2229c91" type="video/mp4"
poster="https://pikwizard.com/pw/medium/d6c34ebcd12c12847d9a59c6781ed001.jpg"/>
Your browser does not support the video tag.
</video>
<p style="font-size: 12px; margin: 0;">PikWizard</p>
</a>
</span>
</span>
Free (free of charge)
Free for personal and commercial use.
Author: Awesome Content