
- Home >
- Stock Videos >
- Dynamic Visualization of Global Financial Data Trends
Dynamic Visualization of Global Financial Data Trends Video

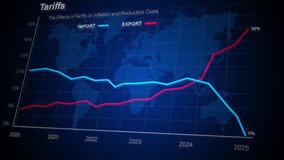
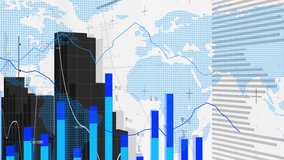
This visualization showcases various financial statistics and data trends, featuring dynamic red and blue lines against a global backdrop. Ideal for presentations on business analytics, finance, or data science, it emphasizes the importance of global data processing and analysis for informed decision-making. The digital grid and globe highlight the interconnected nature of global markets.
Powered by  - Get 15% off with code: PIKWIZARD15


0
downloads
downloads
Tags:
More
Credit Photo
If you would like to credit the Photo, here are some ways you can do so
Text Link
video Link
<span class="text-link">
<span>
<a target="_blank" href=https://pikwizard.com/video/dynamic-visualization-of-global-financial-data-trends/9c16900ee129d95ec6843a70fd20b742/>PikWizard</a>
</span>
</span>
<span class="image-link">
<span
style="margin: 0 0 20px 0; display: inline-block; vertical-align: middle; width: 100%;"
>
<a
target="_blank"
href="https://pikwizard.com/video/dynamic-visualization-of-global-financial-data-trends/9c16900ee129d95ec6843a70fd20b742/"
style="text-decoration: none; font-size: 10px; margin: 0;"
>
<video controls style="width: 100%; margin: 0;">
<source src="https://player.vimeo.com/progressive_redirect/playback/763291587/rendition/240p/file.mp4?loc=external&oauth2_token_id=1223210874&signature=0e6bc5b90504af3b2da3a68473f11639c3c7c64e4517cbcb0486f06cff218a09" type="video/mp4"
poster="https://pikwizard.com/pw/medium/9c16900ee129d95ec6843a70fd20b742.jpg"/>
Your browser does not support the video tag.
</video>
<p style="font-size: 12px; margin: 0;">PikWizard</p>
</a>
</span>
</span>
Free (free of charge)
Free for personal and commercial use.
Author: Awesome Content