
- Home >
- Stock Videos >
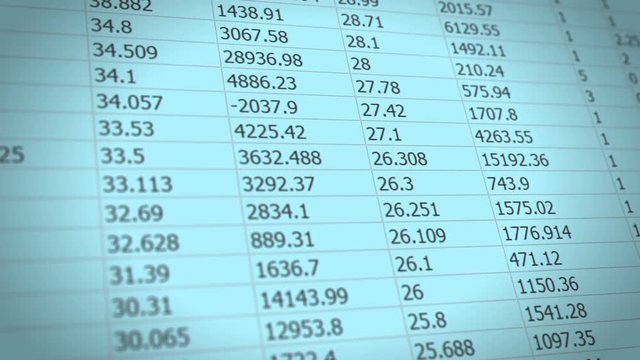
- Dynamic Visualization of Global Market Data Trends
Dynamic Visualization of Global Market Data Trends Video
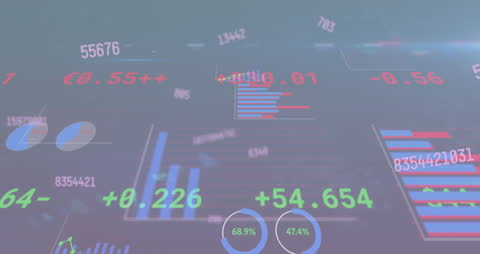
Dynamic visualization depicts rapidly changing numbers and statistical graphs, symbolizing real-time data processing in the stock market. Serves as an ideal representation for themes related to global business, financial technology, and economic analysis. Perfectly suited for illustrating articles on investment strategies, data visualization techniques, and worldwide market behaviors.
Powered by 


1
downloads
downloads
Tags:
More
Credit Photo
If you would like to credit the Photo, here are some ways you can do so
Text Link
video Link
<span class="text-link">
<span>
<a target="_blank" href=https://pikwizard.com/video/dynamic-visualization-of-global-market-data-trends/e3543b59259baf0453ccc5273bd5069c/>PikWizard</a>
</span>
</span>
<span class="image-link">
<span
style="margin: 0 0 20px 0; display: inline-block; vertical-align: middle; width: 100%;"
>
<a
target="_blank"
href="https://pikwizard.com/video/dynamic-visualization-of-global-market-data-trends/e3543b59259baf0453ccc5273bd5069c/"
style="text-decoration: none; font-size: 10px; margin: 0;"
>
<video controls style="width: 100%; margin: 0;">
<source src="https://player.vimeo.com/progressive_redirect/playback/850050445/rendition/720p/file.mp4?loc=external&oauth2_token_id=1223210874&signature=1b634e4753d4a579e57dde10a64c83317a2af1eb41ed2204db3b8ee145679436" type="video/mp4"
poster="https://pikwizard.com/pw/medium/e3543b59259baf0453ccc5273bd5069c.jpg"/>
Your browser does not support the video tag.
</video>
<p style="font-size: 12px; margin: 0;">PikWizard</p>
</a>
</span>
</span>
Free (free of charge)
Free for personal and commercial use.
Author: Awesome Content