
- Home >
- Stock Videos >
- Eco Icons Map Enhancing Global CO2 Trend Analysis and Data Visualization
Eco Icons Map Enhancing Global CO2 Trend Analysis and Data Visualization Video
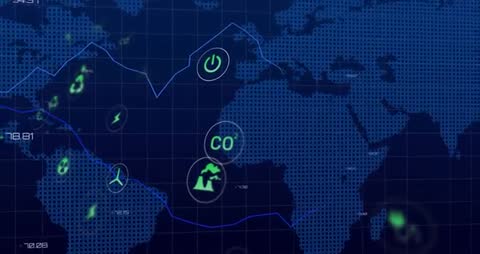
Map layered with drifting eco-friendly icons and graphs illustrating fluctuations in CO2 trends. Elements glow elevating focus on sustainability efforts or environmental education. Useful in digital presentations about climate change, global acknowledgment efforts, educating energy impacts.

downloads
Tags:
More
Credit Photo
If you would like to credit the Photo, here are some ways you can do so
Text Link
video Link
<span class="text-link">
<span>
<a target="_blank" href=https://pikwizard.com/video/eco-icons-map-enhancing-global-co2-trend-analysis-and-data-visualization/8238f659f61a08e8dd236fd68bf94ada/>PikWizard</a>
</span>
</span>
<span class="image-link">
<span
style="margin: 0 0 20px 0; display: inline-block; vertical-align: middle; width: 100%;"
>
<a
target="_blank"
href="https://pikwizard.com/video/eco-icons-map-enhancing-global-co2-trend-analysis-and-data-visualization/8238f659f61a08e8dd236fd68bf94ada/"
style="text-decoration: none; font-size: 10px; margin: 0;"
>
<video controls style="width: 100%; margin: 0;">
<source src="https://player.vimeo.com/progressive_redirect/playback/1093265882/rendition/240p/file.mp4?loc=external&oauth2_token_id=1223210874&signature=2ff402c28f295866fd4bc321cd639443e9fa84bf1bdbed6aa18726a3acb859b0" type="video/mp4"
poster="https://pikwizard.com/pw/medium/8238f659f61a08e8dd236fd68bf94ada.jpg"/>
Your browser does not support the video tag.
</video>
<p style="font-size: 12px; margin: 0;">PikWizard</p>
</a>
</span>
</span>
Free (free of charge)
Free for personal and commercial use.
Author: Awesome Content