
- Home >
- Stock Videos >
- Economic Data Visualization over Ocean Scene
Economic Data Visualization over Ocean Scene Video
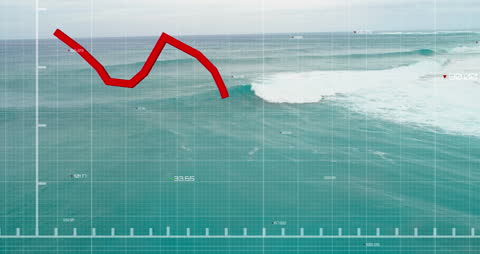
Abstract data animation is shown over an ocean scene. A bright red line graph descends sharply on a grid overlay, indicating a potential decline or drop in economic trends. This can be used for business presentations, financial analytics, technology features, or report covers expressing economic downturns or analyzing climatic impacts on economics and tech.

downloads
Tags:
More
Credit Photo
If you would like to credit the Photo, here are some ways you can do so
Text Link
video Link
<span class="text-link">
<span>
<a target="_blank" href=https://pikwizard.com/video/economic-data-visualization-over-ocean-scene/67be28ab50ae7926bf9cb68ff7ae1922/>PikWizard</a>
</span>
</span>
<span class="image-link">
<span
style="margin: 0 0 20px 0; display: inline-block; vertical-align: middle; width: 100%;"
>
<a
target="_blank"
href="https://pikwizard.com/video/economic-data-visualization-over-ocean-scene/67be28ab50ae7926bf9cb68ff7ae1922/"
style="text-decoration: none; font-size: 10px; margin: 0;"
>
<video controls style="width: 100%; margin: 0;">
<source src="https://player.vimeo.com/progressive_redirect/playback/768325318/rendition/240p/file.mp4?loc=external&oauth2_token_id=1223210874&signature=40c442b06fdaafc89f5804a6339a2f873036555511e066c440f76d201d219808" type="video/mp4"
poster="https://pikwizard.com/pw/medium/67be28ab50ae7926bf9cb68ff7ae1922.jpg"/>
Your browser does not support the video tag.
</video>
<p style="font-size: 12px; margin: 0;">PikWizard</p>
</a>
</span>
</span>
Free (free of charge)
Free for personal and commercial use.
Author: Awesome Content