
- Home >
- Stock Videos >
- EU Economic Analysis and Financial Data Visualization
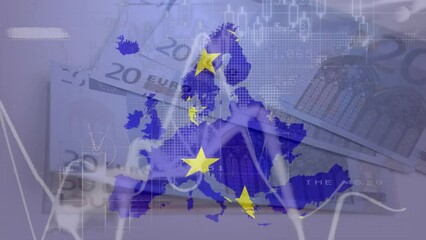
EU Economic Analysis and Financial Data Visualization Video
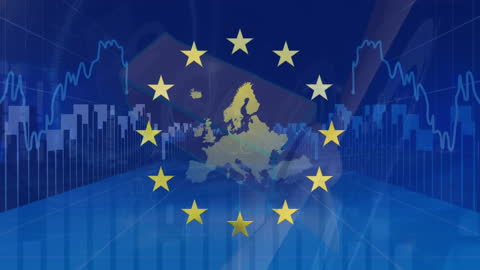
Shows European Union stars overlay on financial graphs and data trends. There is often usage in economic reports, presentations on EU markets, educational materials for economics, or visual content related to European financial institutions and developments.
Powered by 


downloads
Tags:
More
Credit Photo
If you would like to credit the Photo, here are some ways you can do so
Text Link
video Link
<span class="text-link">
<span>
<a target="_blank" href=https://pikwizard.com/video/eu-economic-analysis-and-financial-data-visualization/d85bd85f980953aeb3173fae1199a334/>PikWizard</a>
</span>
</span>
<span class="image-link">
<span
style="margin: 0 0 20px 0; display: inline-block; vertical-align: middle; width: 100%;"
>
<a
target="_blank"
href="https://pikwizard.com/video/eu-economic-analysis-and-financial-data-visualization/d85bd85f980953aeb3173fae1199a334/"
style="text-decoration: none; font-size: 10px; margin: 0;"
>
<video controls style="width: 100%; margin: 0;">
<source src="https://player.vimeo.com/progressive_redirect/playback/910215342/rendition/240p/file.mp4?loc=external&oauth2_token_id=1223210874&signature=01f35a2ff912d2871dfed9c0cc04bcfeb10c4aa85f9b829e322c008f7b684265" type="video/mp4"
poster="https://pikwizard.com/pw/medium/d85bd85f980953aeb3173fae1199a334.jpg"/>
Your browser does not support the video tag.
</video>
<p style="font-size: 12px; margin: 0;">PikWizard</p>
</a>
</span>
</span>
Free (free of charge)
Free for personal and commercial use.
Author: Awesome Content