
- Home >
- Stock Videos >
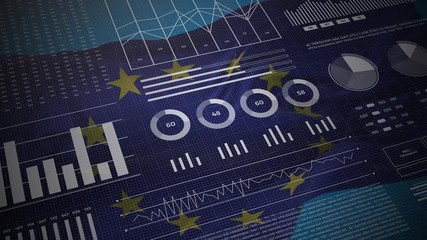
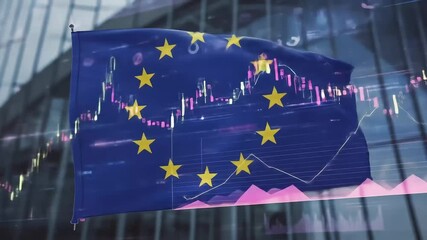
- European Economic Data Visualization with Financial Graphics
European Economic Data Visualization with Financial Graphics Video
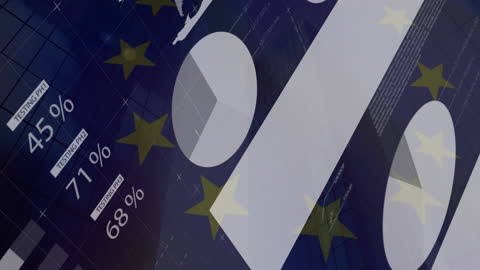
Interesting overlay evokes modern analysis practices prioritizing finance color chart overlays, perfect for blogs, articles, presentations about EU economy trends, modern statistical methods for economic data.
Powered by 


downloads
Tags:
More
Credit Photo
If you would like to credit the Photo, here are some ways you can do so
Text Link
video Link
<span class="text-link">
<span>
<a target="_blank" href=https://pikwizard.com/video/european-economic-data-visualization-with-financial-graphics/67a29f6bb071bf0219daeeecd722b3f8/>PikWizard</a>
</span>
</span>
<span class="image-link">
<span
style="margin: 0 0 20px 0; display: inline-block; vertical-align: middle; width: 100%;"
>
<a
target="_blank"
href="https://pikwizard.com/video/european-economic-data-visualization-with-financial-graphics/67a29f6bb071bf0219daeeecd722b3f8/"
style="text-decoration: none; font-size: 10px; margin: 0;"
>
<video controls style="width: 100%; margin: 0;">
<source src="https://player.vimeo.com/progressive_redirect/playback/907875832/rendition/240p/file.mp4?loc=external&oauth2_token_id=1223210874&signature=2809969e0531faba49e1740f384233bb2b933af391e774a8d8c6acb7f94a889b" type="video/mp4"
poster="https://pikwizard.com/pw/medium/67a29f6bb071bf0219daeeecd722b3f8.jpg"/>
Your browser does not support the video tag.
</video>
<p style="font-size: 12px; margin: 0;">PikWizard</p>
</a>
</span>
</span>
Free (free of charge)
Free for personal and commercial use.
Author: Awesome Content