
- Home >
- Free Stock Videos >
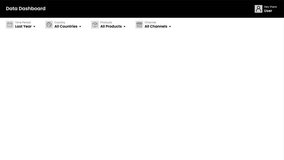
- Executive Pointing at Data Dashboard While Analyst Explaining Charts in Vertical Video
Executive Pointing at Data Dashboard While Analyst Explaining Charts in Vertical Free Stock Video

AI
AI Generated Video. Executive pointing at data dashboard while analyst explaining charts and performance trends. Screen displaying colorful bar charts, line graphs, and KPIs, with hand gestures highlighting specific data points. Scene focusing on teamwork, decision making, and strategic review during meeting at modern office. Video working well for corporate presentations, investor updates, training modules, social media vertical ads, and website hero clips. Useful for illustrating analytics, business growth, data-driven decisions, collaboration, leadership communication, and executive briefings.
Powered by  - Get 15% off with code: PIKWIZARD15


downloads
Tags:
More
Credit Photo
If you would like to credit the Photo, here are some ways you can do so
Text Link
video Link
<span class="text-link">
<span>
<a target="_blank" href=https://pikwizard.com/video/executive-pointing-at-data-dashboard-while-analyst-explaining-charts-in-vertical-video/829d440ef3e60a30fb66f704b3698c4d/>PikWizard</a>
</span>
</span>
<span class="image-link">
<span
style="margin: 0 0 20px 0; display: inline-block; vertical-align: middle; width: 100%;"
>
<a
target="_blank"
href="https://pikwizard.com/video/executive-pointing-at-data-dashboard-while-analyst-explaining-charts-in-vertical-video/829d440ef3e60a30fb66f704b3698c4d/"
style="text-decoration: none; font-size: 10px; margin: 0;"
>
<video controls style="width: 100%; margin: 0;">
<source src="https://player.vimeo.com/progressive_redirect/playback/1193691023/rendition/240p/file.mp4%20%28240p%29.mp4?loc=external&oauth2_token_id=1223210874&signature=5ad99de26f8eb3d1870dc349f2931e1b144018e22c214d72425ac59f1ef8db86" type="video/mp4"
poster="https://thumbs.wbm.im/pw/medium/829d440ef3e60a30fb66f704b3698c4d.jpg"/>
Your browser does not support the video tag.
</video>
<p style="font-size: 12px; margin: 0;">PikWizard</p>
</a>
</span>
</span>
Free (free of charge)
Free for personal and commercial use.
Author: AI Creator