
- Home >
- Stock Videos >
- Eye Chart Overlaid with Data Visualization in Digital Design
Eye Chart Overlaid with Data Visualization in Digital Design Video
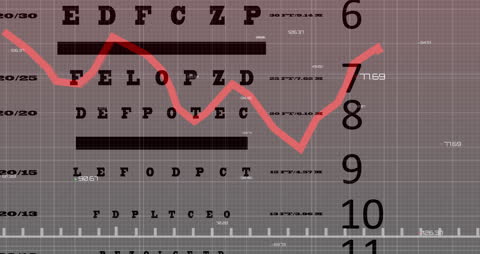
This visual depicts an eye chart overlaid with a data visualization graph, signifying the merging of business analytics and visual clarity—and is ideal for materials concerning finance, technology integration, optometry advancement, interdisciplinary strategies, or educational content on enhancing vision trends and data metrics. Suitable for articles, websites, and presentations focusing on innovative business solutions.

downloads
Tags:
More
Credit Photo
If you would like to credit the Photo, here are some ways you can do so
Text Link
video Link
<span class="text-link">
<span>
<a target="_blank" href=https://pikwizard.com/video/eye-chart-overlaid-with-data-visualization-in-digital-design/f15968a5cb9f45c57e22621e4665685d/>PikWizard</a>
</span>
</span>
<span class="image-link">
<span
style="margin: 0 0 20px 0; display: inline-block; vertical-align: middle; width: 100%;"
>
<a
target="_blank"
href="https://pikwizard.com/video/eye-chart-overlaid-with-data-visualization-in-digital-design/f15968a5cb9f45c57e22621e4665685d/"
style="text-decoration: none; font-size: 10px; margin: 0;"
>
<video controls style="width: 100%; margin: 0;">
<source src="https://player.vimeo.com/progressive_redirect/playback/718862301/rendition/240p/file.mp4?loc=external&oauth2_token_id=1223210874&signature=9b3529dfa9ae97b99e6c56dc42850175efa900fb579b9d1184e62606d28d79b1" type="video/mp4"
poster="https://pikwizard.com/pw/medium/f15968a5cb9f45c57e22621e4665685d.jpg"/>
Your browser does not support the video tag.
</video>
<p style="font-size: 12px; margin: 0;">PikWizard</p>
</a>
</span>
</span>
Free (free of charge)
Free for personal and commercial use.
Author: Awesome Content