
- Home >
- Stock Videos >
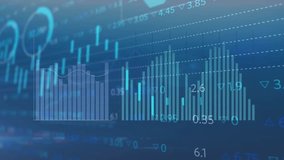
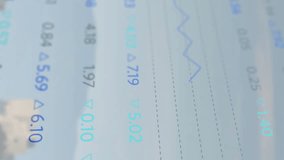
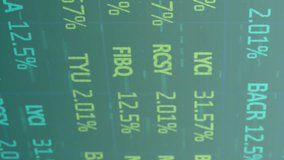
- Financial Analysis and Data Visualization Seamless Transition
Financial Analysis and Data Visualization Seamless Transition Video
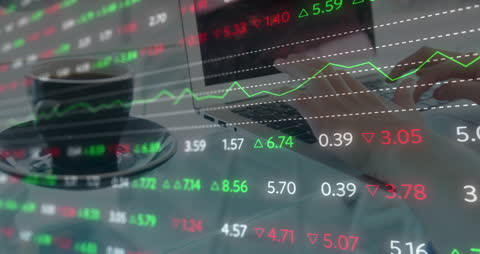
Image shows integration of a person's hands using a laptop overlaid with fluctuating green and red financial data, representing stock market trends. Use for finance, technology blogs, trading websites, and presentations focused on financial markets or digital business tools.
Powered by  - Get 15% off with code: PIKWIZARD15


downloads
Tags:
More
Credit Photo
If you would like to credit the Photo, here are some ways you can do so
Text Link
video Link
<span class="text-link">
<span>
<a target="_blank" href=https://pikwizard.com/video/financial-analysis-and-data-visualization-seamless-transition/53133895f38574bff9f768739e9607dd/>PikWizard</a>
</span>
</span>
<span class="image-link">
<span
style="margin: 0 0 20px 0; display: inline-block; vertical-align: middle; width: 100%;"
>
<a
target="_blank"
href="https://pikwizard.com/video/financial-analysis-and-data-visualization-seamless-transition/53133895f38574bff9f768739e9607dd/"
style="text-decoration: none; font-size: 10px; margin: 0;"
>
<video controls style="width: 100%; margin: 0;">
<source src="https://player.vimeo.com/progressive_redirect/playback/774037684/rendition/240p/file.mp4?loc=external&oauth2_token_id=1223210874&signature=7b91b2ffed8ebf74580f60f0a552181af9c821c48651befac2250ccc03923a77" type="video/mp4"
poster="https://pikwizard.com/pw/medium/53133895f38574bff9f768739e9607dd.jpg"/>
Your browser does not support the video tag.
</video>
<p style="font-size: 12px; margin: 0;">PikWizard</p>
</a>
</span>
</span>
Free (free of charge)
Free for personal and commercial use.
Author: Awesome Content