
- Home >
- Stock Videos >
- Financial Analysis with Graphs and Data Visualization
Financial Analysis with Graphs and Data Visualization Video
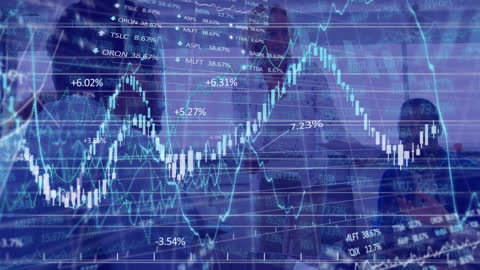
Rows of graphs and percentages overlay conversations among a diverse group in an office. This energetic blend represents audits or financial meetings, ideal for illustrating finance-related reports, data-driven teamwork, publications on business analytics, or articles on financial technology impacting diverse markets.

downloads
Tags:
More
Credit Photo
If you would like to credit the Photo, here are some ways you can do so
Text Link
video Link
<span class="text-link">
<span>
<a target="_blank" href=https://pikwizard.com/video/financial-analysis-with-graphs-and-data-visualization/4423386f9eb4154d55010d7fd8953e18/>PikWizard</a>
</span>
</span>
<span class="image-link">
<span
style="margin: 0 0 20px 0; display: inline-block; vertical-align: middle; width: 100%;"
>
<a
target="_blank"
href="https://pikwizard.com/video/financial-analysis-with-graphs-and-data-visualization/4423386f9eb4154d55010d7fd8953e18/"
style="text-decoration: none; font-size: 10px; margin: 0;"
>
<video controls style="width: 100%; margin: 0;">
<source src="https://player.vimeo.com/progressive_redirect/playback/772889550/rendition/240p/file.mp4?loc=external&oauth2_token_id=1223210874&signature=263f4a064e6acb46eeda14783c01354d8b04cc0aa8fe88ec2a68f1d76bc74cb0" type="video/mp4"
poster="https://pikwizard.com/pw/medium/4423386f9eb4154d55010d7fd8953e18.jpg"/>
Your browser does not support the video tag.
</video>
<p style="font-size: 12px; margin: 0;">PikWizard</p>
</a>
</span>
</span>
Free (free of charge)
Free for personal and commercial use.
Author: Awesome Content