
- Home >
- Stock Videos >
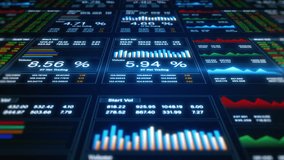
- Financial Analyst Working with Digital Data Visualization on Laptop
Financial Analyst Working with Digital Data Visualization on Laptop Video

This video showcases financial data displayed on a screen, detected by overlaying a man analyzing stocks on a laptop computer. The intertwining of data graphs and someone actively engaging with digital information lends a futuristic vibe, suitable for illustrating modern finance or technology websites. Useful for articles related to financial education, trend analysis, stock market updates, and company webinars focusing on investment strategies.
Powered by  - Get 15% off with code: PIKWIZARD15


downloads
Tags:
More
Credit Photo
If you would like to credit the Photo, here are some ways you can do so
Text Link
video Link
<span class="text-link">
<span>
<a target="_blank" href=https://pikwizard.com/video/financial-analyst-working-with-digital-data-visualization-on-laptop/0811c886bff19542a2d75c5fae455653/>PikWizard</a>
</span>
</span>
<span class="image-link">
<span
style="margin: 0 0 20px 0; display: inline-block; vertical-align: middle; width: 100%;"
>
<a
target="_blank"
href="https://pikwizard.com/video/financial-analyst-working-with-digital-data-visualization-on-laptop/0811c886bff19542a2d75c5fae455653/"
style="text-decoration: none; font-size: 10px; margin: 0;"
>
<video controls style="width: 100%; margin: 0;">
<source src="https://player.vimeo.com/progressive_redirect/playback/831769834/rendition/240p/file.mp4?loc=external&oauth2_token_id=1223210874&signature=46d109e25c8021680e88928f7f4607aa1b7a55a0a437a8f518cbd4a9b810c2ae" type="video/mp4"
poster="https://pikwizard.com/pw/medium/0811c886bff19542a2d75c5fae455653.jpg"/>
Your browser does not support the video tag.
</video>
<p style="font-size: 12px; margin: 0;">PikWizard</p>
</a>
</span>
</span>
Free (free of charge)
Free for personal and commercial use.
Author: Awesome Content