
- Home >
- Stock Videos >
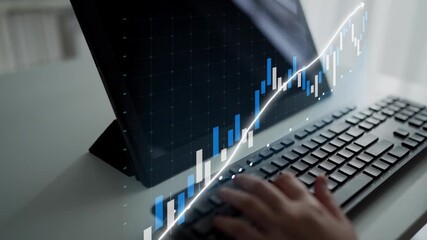
- Financial Analytics with Real-Time Stock Market Data Visualization
Financial Analytics with Real-Time Stock Market Data Visualization Video
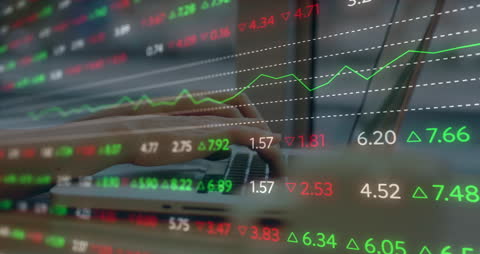
Data analysts and financial experts may find this video useful for presentations about market trends and real-time data processing. The video highlights a concept of digital interfaces interacting with stock market metrics, useful for conveying themes of investment, business technology, and modern economic analysis.
Powered by 


0
downloads
downloads
Tags:
More
Credit Photo
If you would like to credit the Photo, here are some ways you can do so
Text Link
video Link
<span class="text-link">
<span>
<a target="_blank" href=https://pikwizard.com/video/financial-analytics-with-real-time-stock-market-data-visualization/be62b325b098060840b888418fe903db/>PikWizard</a>
</span>
</span>
<span class="image-link">
<span
style="margin: 0 0 20px 0; display: inline-block; vertical-align: middle; width: 100%;"
>
<a
target="_blank"
href="https://pikwizard.com/video/financial-analytics-with-real-time-stock-market-data-visualization/be62b325b098060840b888418fe903db/"
style="text-decoration: none; font-size: 10px; margin: 0;"
>
<video controls style="width: 100%; margin: 0;">
<source src="https://player.vimeo.com/progressive_redirect/playback/747494139/rendition/240p/file.mp4?loc=external&oauth2_token_id=1223210874&signature=270101332e37c1aa39bfba527e76846d5c0f356aa98d0557b11fc6622be4ef3f" type="video/mp4"
poster="https://pikwizard.com/pw/medium/be62b325b098060840b888418fe903db.jpg"/>
Your browser does not support the video tag.
</video>
<p style="font-size: 12px; margin: 0;">PikWizard</p>
</a>
</span>
</span>
Free (free of charge)
Free for personal and commercial use.
Author: Awesome Content