
- Home >
- Stock Videos >
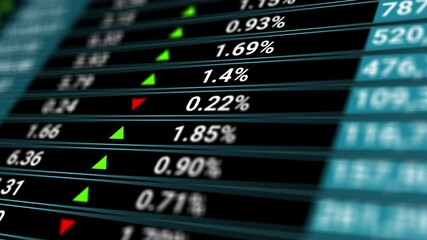
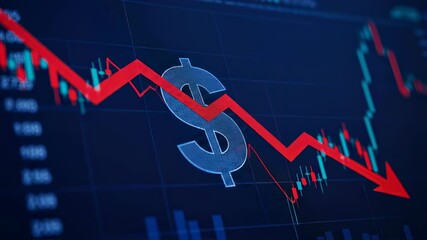
- Financial and Stock Market Data with Graph Animations
Financial and Stock Market Data with Graph Animations Video
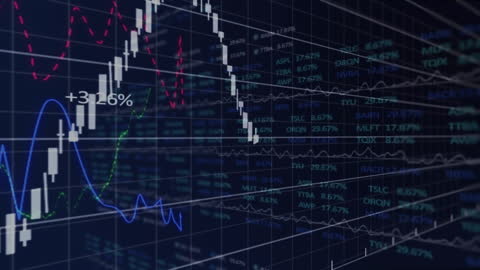
Digital display of animated financial and stock market data showing charts and percentages, symbolizing the dynamic nature of the global economy. Useful for presentations on finance, investment strategies, trading insights, and economic changes.
Powered by 


2
downloads
downloads
Tags:
More
Credit Photo
If you would like to credit the Photo, here are some ways you can do so
Text Link
video Link
<span class="text-link">
<span>
<a target="_blank" href=https://pikwizard.com/video/financial-and-stock-market-data-with-graph-animations/ad3ed30b66386ab7aeac56dc822697b0/>PikWizard</a>
</span>
</span>
<span class="image-link">
<span
style="margin: 0 0 20px 0; display: inline-block; vertical-align: middle; width: 100%;"
>
<a
target="_blank"
href="https://pikwizard.com/video/financial-and-stock-market-data-with-graph-animations/ad3ed30b66386ab7aeac56dc822697b0/"
style="text-decoration: none; font-size: 10px; margin: 0;"
>
<video controls style="width: 100%; margin: 0;">
<source src="https://player.vimeo.com/progressive_redirect/playback/875597216/rendition/360p/file.mp4?loc=external&oauth2_token_id=1223210874&signature=2277b1dcc37210d4272e5ecebc9d4dcaf912ba24e06d71dfbd5579f647793540" type="video/mp4"
poster="https://pikwizard.com/pw/medium/ad3ed30b66386ab7aeac56dc822697b0.jpg"/>
Your browser does not support the video tag.
</video>
<p style="font-size: 12px; margin: 0;">PikWizard</p>
</a>
</span>
</span>
Free (free of charge)
Free for personal and commercial use.
Author: Awesome Content