
- Home >
- Stock Videos >
- Financial Chart Animation with Statistical Data Analysis
Financial Chart Animation with Statistical Data Analysis Video
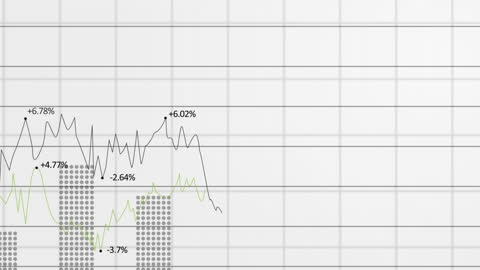
Visual representation of financial data through animated charts showcases real-time analysis, ideal for presentations on market trends, economic reports, or investment strategies in financial sectors. Useful for multimedia content requiring visual data analysis elements.

downloads
Tags:
More
Credit Photo
If you would like to credit the Photo, here are some ways you can do so
Text Link
video Link
<span class="text-link">
<span>
<a target="_blank" href=https://pikwizard.com/video/financial-chart-animation-with-statistical-data-analysis/2a3902b17f7660f3f039023de84ea7a4/>PikWizard</a>
</span>
</span>
<span class="image-link">
<span
style="margin: 0 0 20px 0; display: inline-block; vertical-align: middle; width: 100%;"
>
<a
target="_blank"
href="https://pikwizard.com/video/financial-chart-animation-with-statistical-data-analysis/2a3902b17f7660f3f039023de84ea7a4/"
style="text-decoration: none; font-size: 10px; margin: 0;"
>
<video controls style="width: 100%; margin: 0;">
<source src="https://player.vimeo.com/progressive_redirect/playback/826772226/rendition/240p/file.mp4?loc=external&oauth2_token_id=1223210874&signature=7c8167f080a6fef12658ad77dbf3d23d7e3dae4aa1649e28419e78aceb70a3fe" type="video/mp4"
poster="https://pikwizard.com/pw/medium/2a3902b17f7660f3f039023de84ea7a4.jpg"/>
Your browser does not support the video tag.
</video>
<p style="font-size: 12px; margin: 0;">PikWizard</p>
</a>
</span>
</span>
Free (free of charge)
Free for personal and commercial use.
Author: Awesome Content