
- Home >
- Stock Videos >
- Financial Data Analysis on Digital Grid Interface
Financial Data Analysis on Digital Grid Interface Video
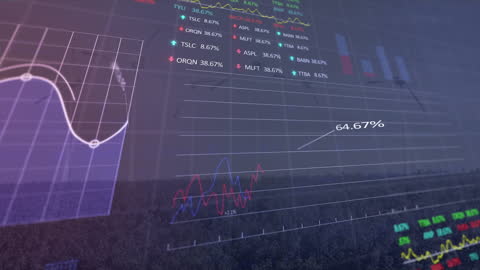
This digital animation showcases financial data analysis on a grid interface. It highlights percentages, charts, and graphs indicative of business trends and global connections. Ideal for presentations and materials in finance, economics, corporate training, or technology sectors.

downloads
Tags:
More
Credit Photo
If you would like to credit the Photo, here are some ways you can do so
Text Link
video Link
<span class="text-link">
<span>
<a target="_blank" href=https://pikwizard.com/video/financial-data-analysis-on-digital-grid-interface/f5436627bcb190f9e6498b2b09b940a6/>PikWizard</a>
</span>
</span>
<span class="image-link">
<span
style="margin: 0 0 20px 0; display: inline-block; vertical-align: middle; width: 100%;"
>
<a
target="_blank"
href="https://pikwizard.com/video/financial-data-analysis-on-digital-grid-interface/f5436627bcb190f9e6498b2b09b940a6/"
style="text-decoration: none; font-size: 10px; margin: 0;"
>
<video controls style="width: 100%; margin: 0;">
<source src="https://player.vimeo.com/progressive_redirect/playback/798441648/rendition/240p/file.mp4?loc=external&oauth2_token_id=1223210874&signature=69fd2466f32c727c001ee21ec0d93e135f5d93c91b9fc3c54fa2e45fdd4b192e" type="video/mp4"
poster="https://pikwizard.com/pw/medium/f5436627bcb190f9e6498b2b09b940a6.jpg"/>
Your browser does not support the video tag.
</video>
<p style="font-size: 12px; margin: 0;">PikWizard</p>
</a>
</span>
</span>
Free (free of charge)
Free for personal and commercial use.
Author: Awesome Content