
- Home >
- Stock Videos >
- Financial Data Analysis with Bar Graph and Digital Interface
Financial Data Analysis with Bar Graph and Digital Interface Video
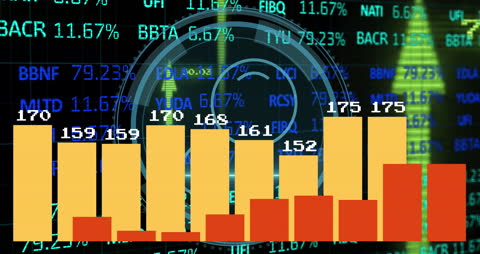
Visual representation of financial data showing analysis through bar graphs foregrounded against a digital trading interface. Useful for illustrating finance reports, stock market analysis, and digital business presentations.
Powered by 


downloads
Tags:
More
Credit Photo
If you would like to credit the Photo, here are some ways you can do so
Text Link
video Link
<span class="text-link">
<span>
<a target="_blank" href=https://pikwizard.com/video/financial-data-analysis-with-bar-graph-and-digital-interface/6265fd885ed17f6a0f553a1b72947a37/>PikWizard</a>
</span>
</span>
<span class="image-link">
<span
style="margin: 0 0 20px 0; display: inline-block; vertical-align: middle; width: 100%;"
>
<a
target="_blank"
href="https://pikwizard.com/video/financial-data-analysis-with-bar-graph-and-digital-interface/6265fd885ed17f6a0f553a1b72947a37/"
style="text-decoration: none; font-size: 10px; margin: 0;"
>
<video controls style="width: 100%; margin: 0;">
<source src="https://player.vimeo.com/progressive_redirect/playback/768496976/rendition/240p/file.mp4?loc=external&oauth2_token_id=1223210874&signature=79ebfc1ab73010d59540bc6fe9eabd89a6342d6b6a5e3251c83ef03e04ca18fe" type="video/mp4"
poster="https://pikwizard.com/pw/medium/6265fd885ed17f6a0f553a1b72947a37.jpg"/>
Your browser does not support the video tag.
</video>
<p style="font-size: 12px; margin: 0;">PikWizard</p>
</a>
</span>
</span>
Free (free of charge)
Free for personal and commercial use.
Author: Awesome Content