
- Home >
- Stock Videos >
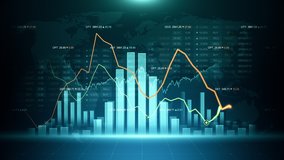
- Financial Data Analysis with Bar Graph and Hexagon Overlays
Financial Data Analysis with Bar Graph and Hexagon Overlays Video

Financial-themed video showcasing an abstract layout with bar graphs and hexagonal overlays symbolizes global business and data processing concepts. Beneficial for illustrating analytical finance articles, financial strategy presentations, or tech-focused reports on business trends.
Powered by  - Get 15% off with code: PIKWIZARD15


downloads
Tags:
More
Credit Photo
If you would like to credit the Photo, here are some ways you can do so
Text Link
video Link
<span class="text-link">
<span>
<a target="_blank" href=https://pikwizard.com/video/financial-data-analysis-with-bar-graph-and-hexagon-overlays/12b40fff77402c21fde749f5a9defe45/>PikWizard</a>
</span>
</span>
<span class="image-link">
<span
style="margin: 0 0 20px 0; display: inline-block; vertical-align: middle; width: 100%;"
>
<a
target="_blank"
href="https://pikwizard.com/video/financial-data-analysis-with-bar-graph-and-hexagon-overlays/12b40fff77402c21fde749f5a9defe45/"
style="text-decoration: none; font-size: 10px; margin: 0;"
>
<video controls style="width: 100%; margin: 0;">
<source src="https://player.vimeo.com/progressive_redirect/playback/890297121/rendition/540p/file.mp4?loc=external&oauth2_token_id=1223210874&signature=bccfabfad7b6f0535ddf7be568073369ec667a134924a951dde7daea5f4d3c88" type="video/mp4"
poster="https://pikwizard.com/pw/medium/12b40fff77402c21fde749f5a9defe45.jpg"/>
Your browser does not support the video tag.
</video>
<p style="font-size: 12px; margin: 0;">PikWizard</p>
</a>
</span>
</span>
Free (free of charge)
Free for personal and commercial use.
Author: Awesome Content
Similar Free Stock Videos
Loading...